Sonification — Representing media as sound. (Lab 5)
Published on December 21, 2023.
Sonification involves converting data or information into sound, allowing individuals to perceive and interpret complex datasets through auditory cues. This technique serves as an alternative or complement to visual representations, aiding in data analysis, accessibility for visually impaired individuals, and enhancing the understanding of patterns or trends in scientific, environmental, or even financial data. Sonification methods vary, employing diverse sound properties such as pitch, rhythm, and amplitude to convey information effectively.
Introduction
Sonification has to do with the audio representation of data. Similar to how we use bar and pie charts to group and visualize datasets, sonification is also applied to generate audio from datasets.
Examples of Sonification Toolkits include:
Sonifier for JavaScript applications.
Twotone is a React application for generating audio from file-based datasets.
STRAUSS for the Python applications.
SoniPy is an open-source Python tool for generating audio from datasets.
Practical uses of Sonification
Some of the areas where Sonification is being used that I find noteworthy to mention are:
Stock exchange market.
Accessibility for people with visual impairment to find objects, places, and areas using sounds. For example, the TFL buses in London beep loudly when releasing the access ramp for wheelchair travelers to board the bus.
Art and Creativity for entertainment purposes.
Data analysis.
Lab Evaluation
The following demo shows my participation in the lab for this topic. The goal of this lab is to use the TrueTone application to visualize a sample dataset and observe how audio changes based on the data within the input dataset. TrueTone is a free and open-source React application by Sonify that enables developers to upload a dataset in either CSV, XLSX, or ODS formats.
Using Sonification to represent data from a Kaggle dataset
For this demo, I am using a Child Mortality Rate dataset from Kaggle created by RASEL AHMED.
Click the Download button to download the dataset in .csv format to your device if you want to follow along with the demonstration.
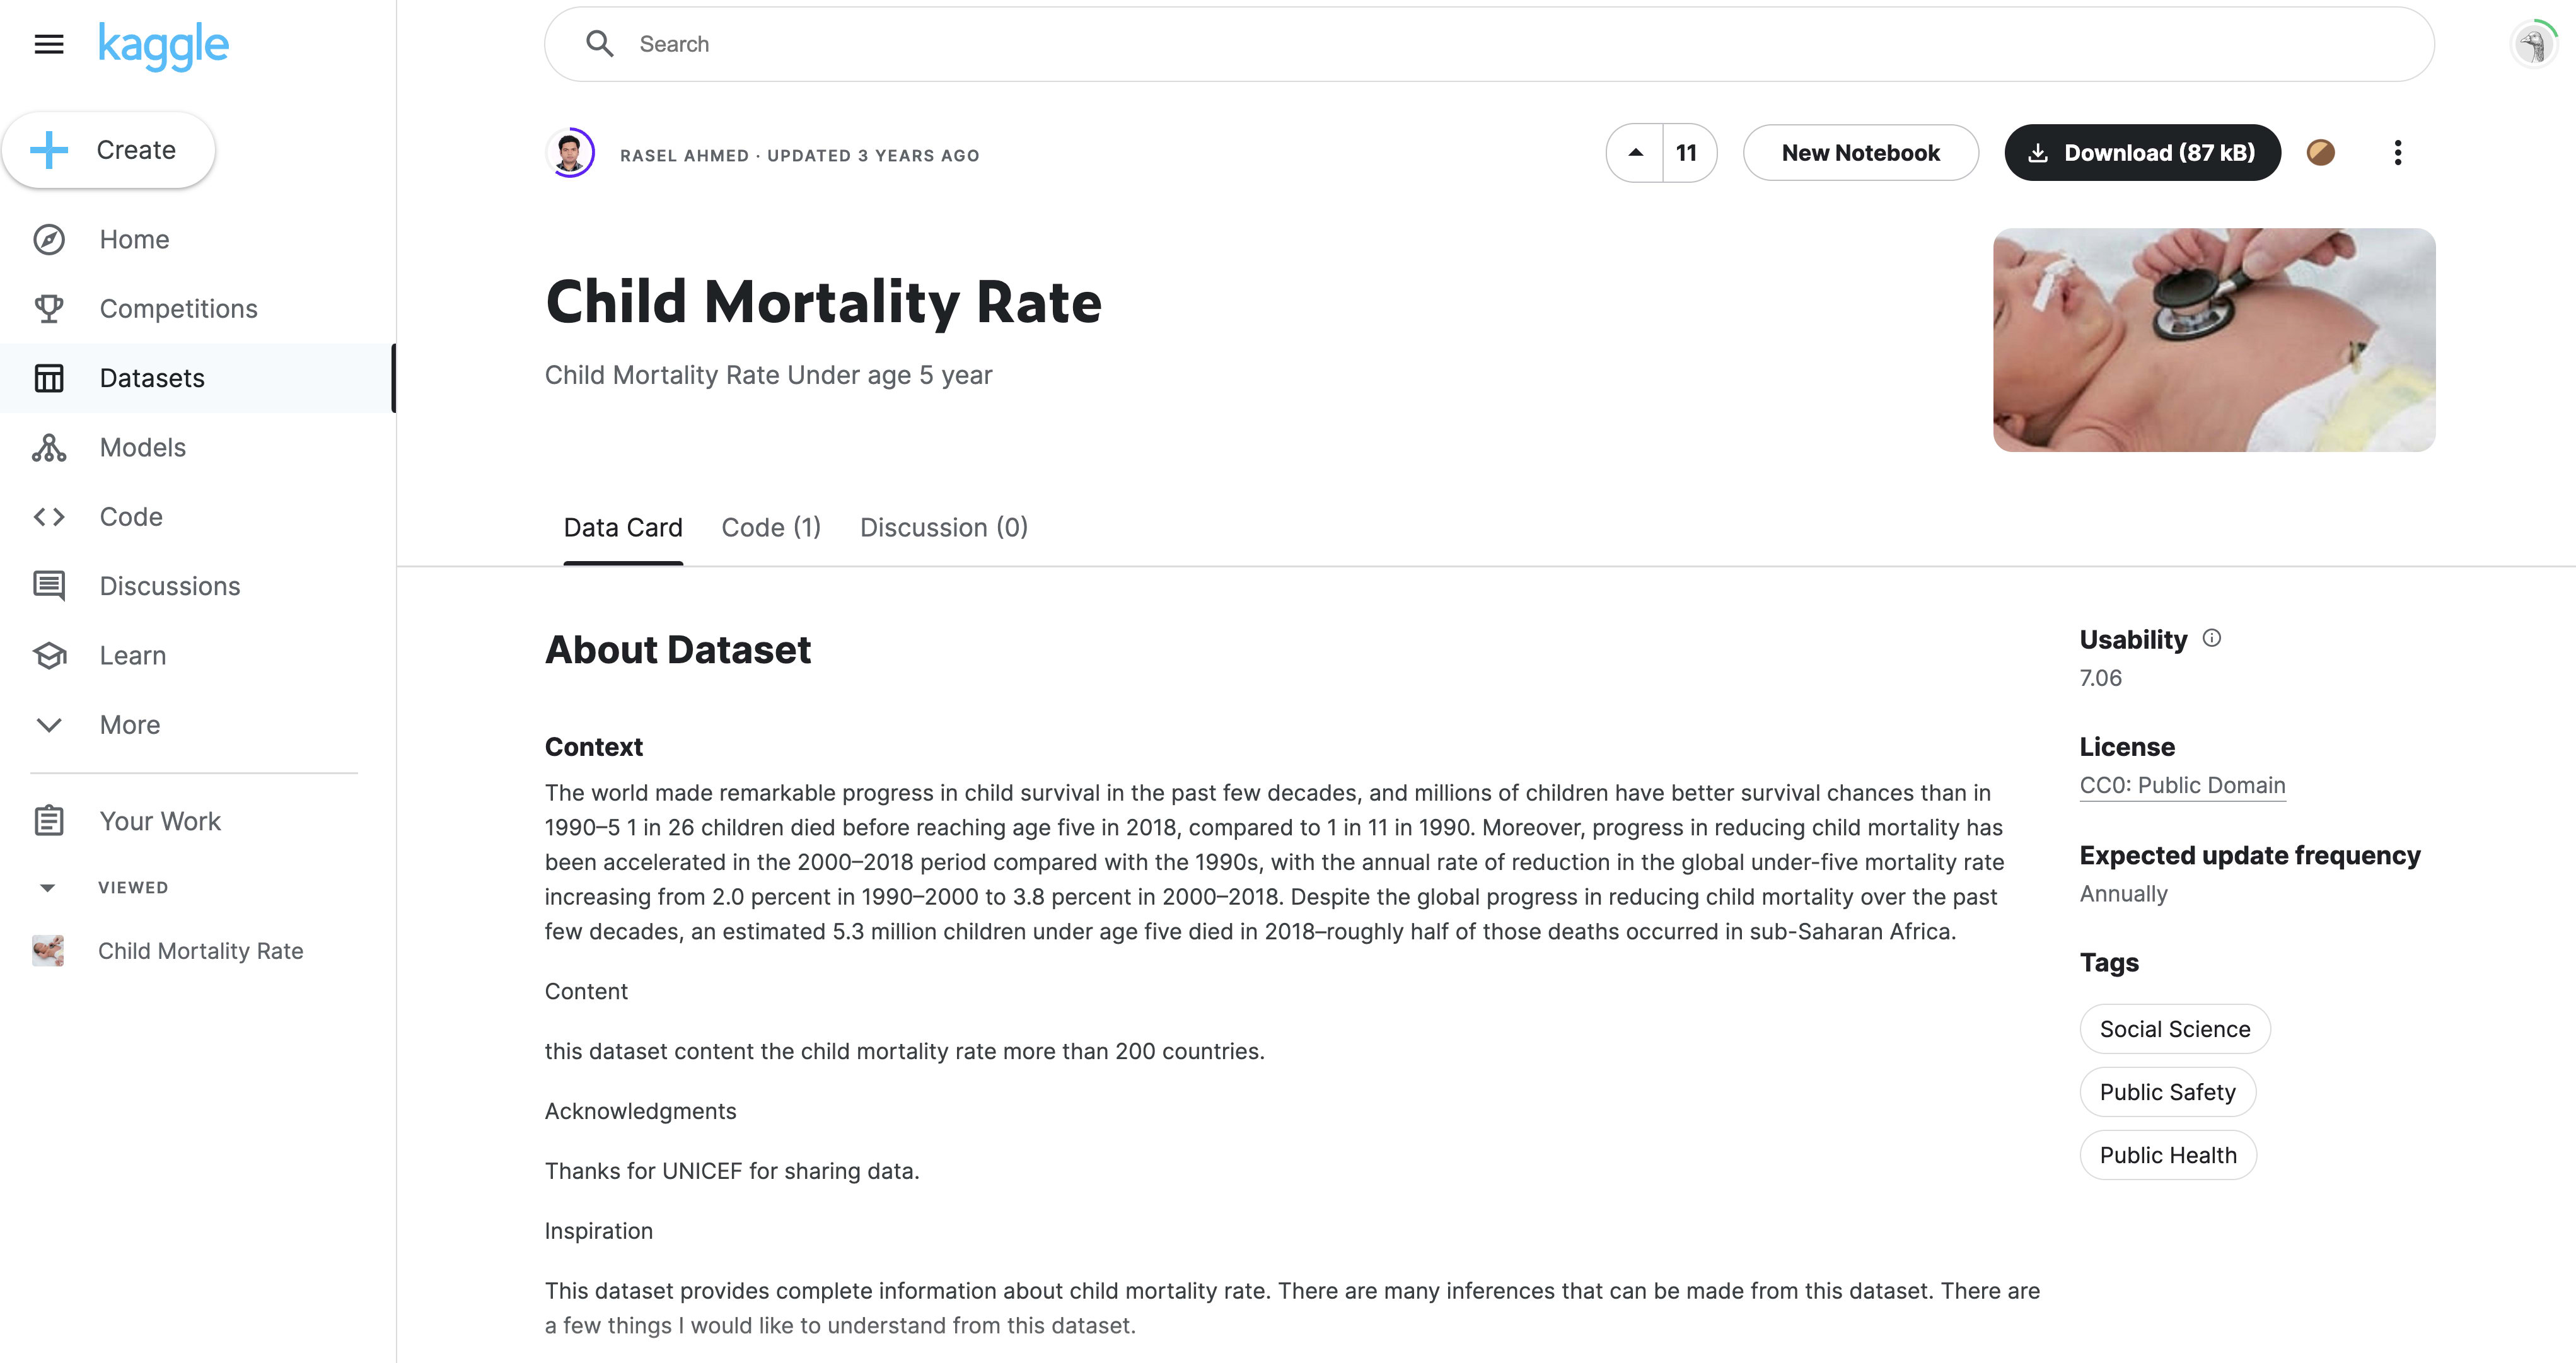
The dataset contains child mortality rates from over 200 countries across 6(six) decades.
Step 1 — Exploring the TrueTone Application
By default, TrueTone provides users with over 10 (ten) sample datasets for testing out the application.
Let's explore generating audio from the sample "Prussian cavalry killed by horse kicks" dataset.
The following image shows the TrueTone player visualizing the "Prussian cavalry killed by horse kicks" dataset using bar charts. The data is generated by the Year column and it is in ascending order as the year increases.
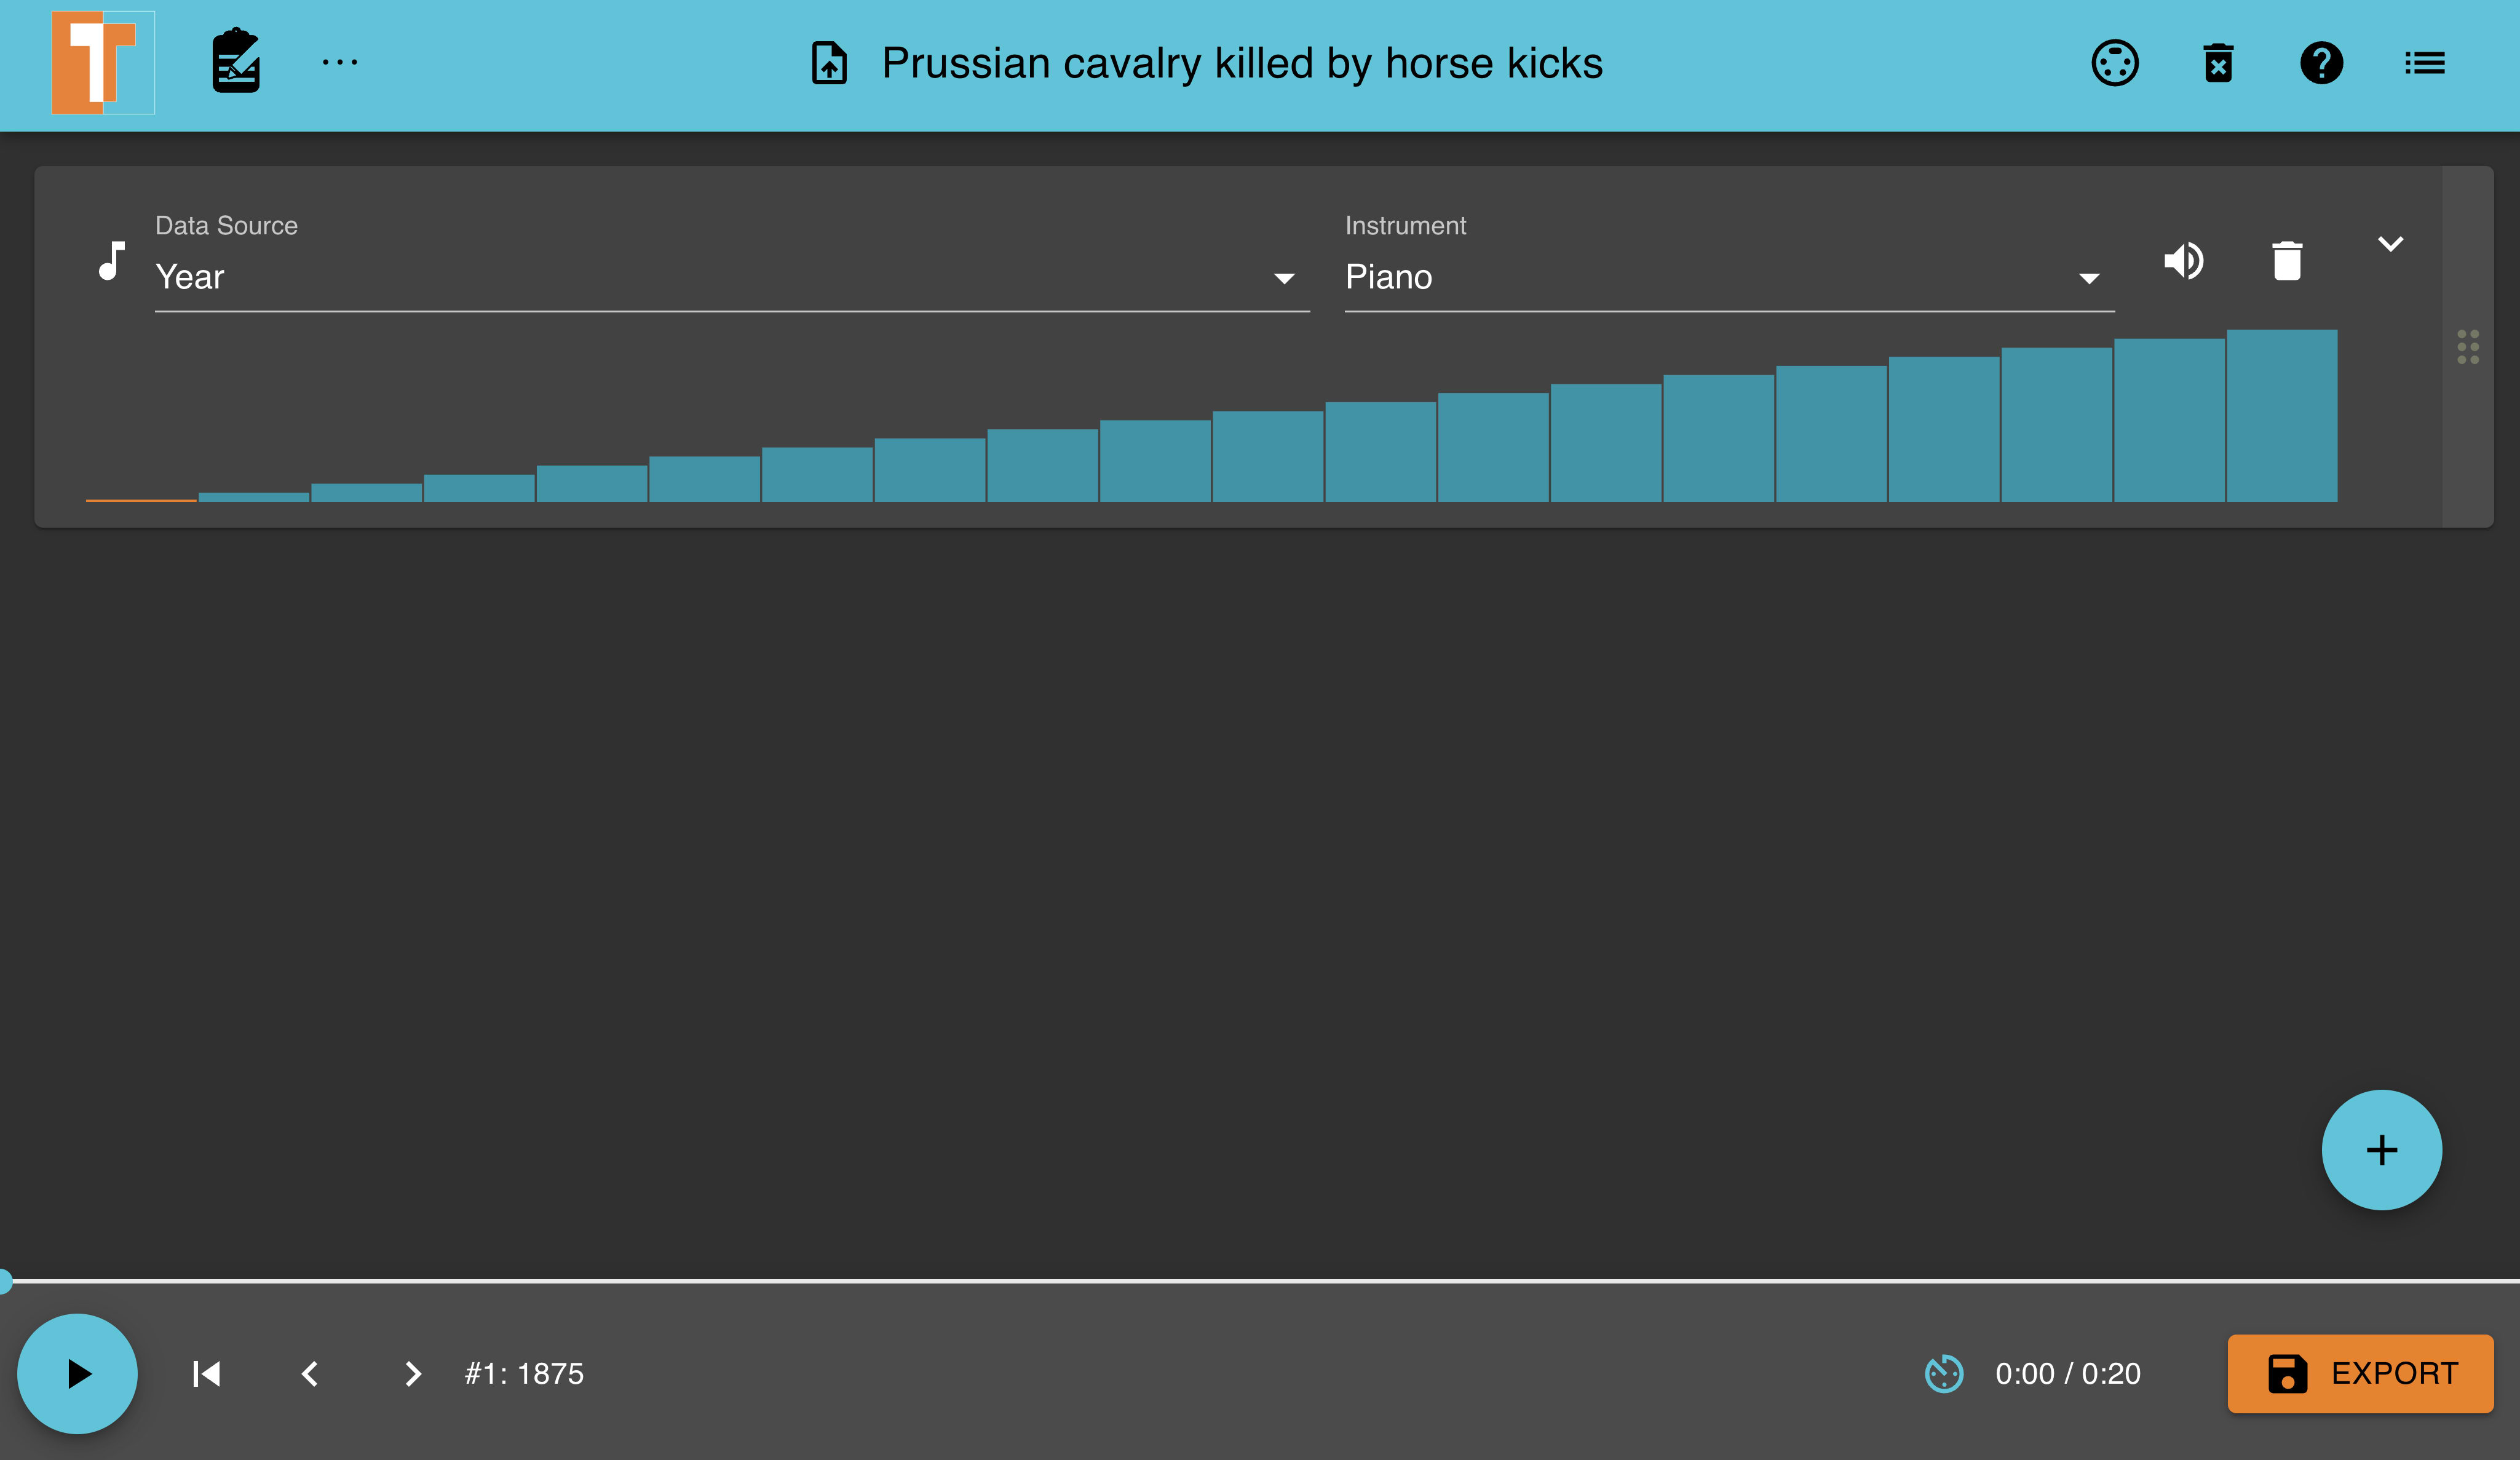
Below is the audio file generated by TrueTone for the "Prussian cavalry killed by horse kicks" dataset using the Year column with a Piano instrument.
prussian-year-piano.mp3
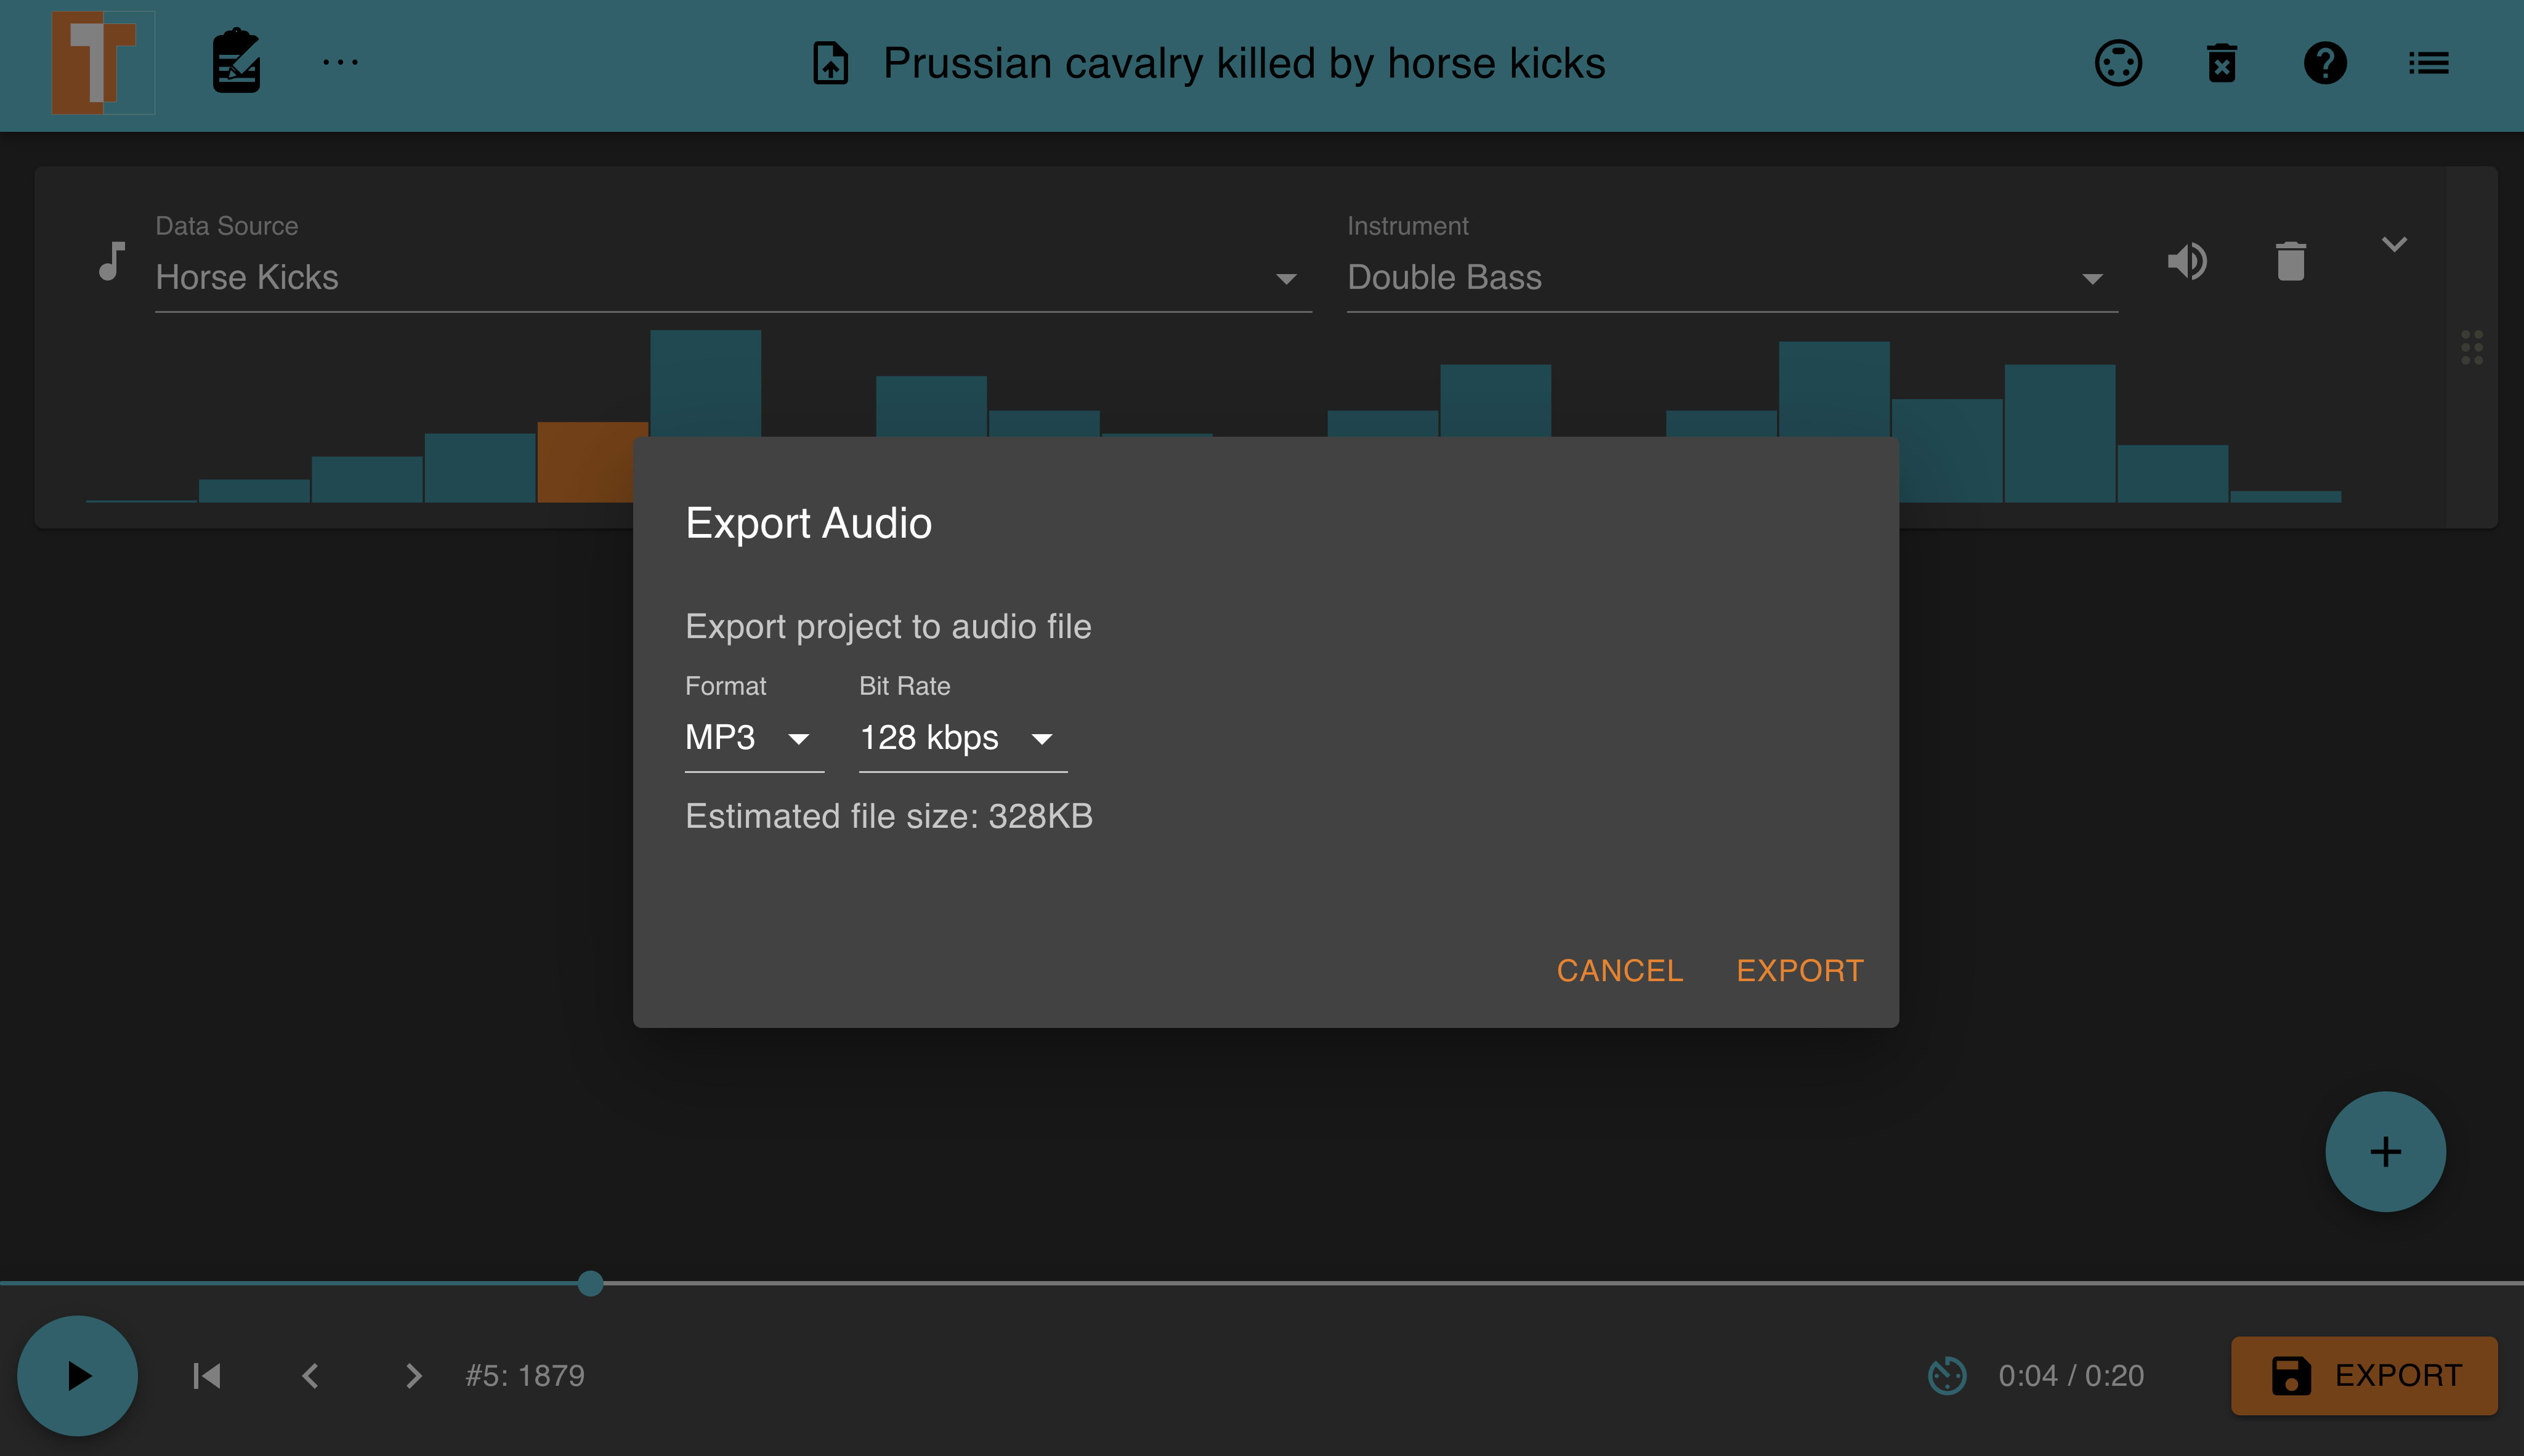
As shown below, Truetone also provides a feature for you to export the audio generated from a dataset to your local device.
Step 2 — Spicing TrueTone's default audio
Let's spice things up with the "Prussian cavalry killed by horse kicks" dataset audio as the default ascending sounding from the Year column is somewhat bland 🥱. We can achieve this by changing the default settings and data source used to generate an audio file.
Click the Data Source dropdown and select the "Horse Kicks" option as shown in the following image.
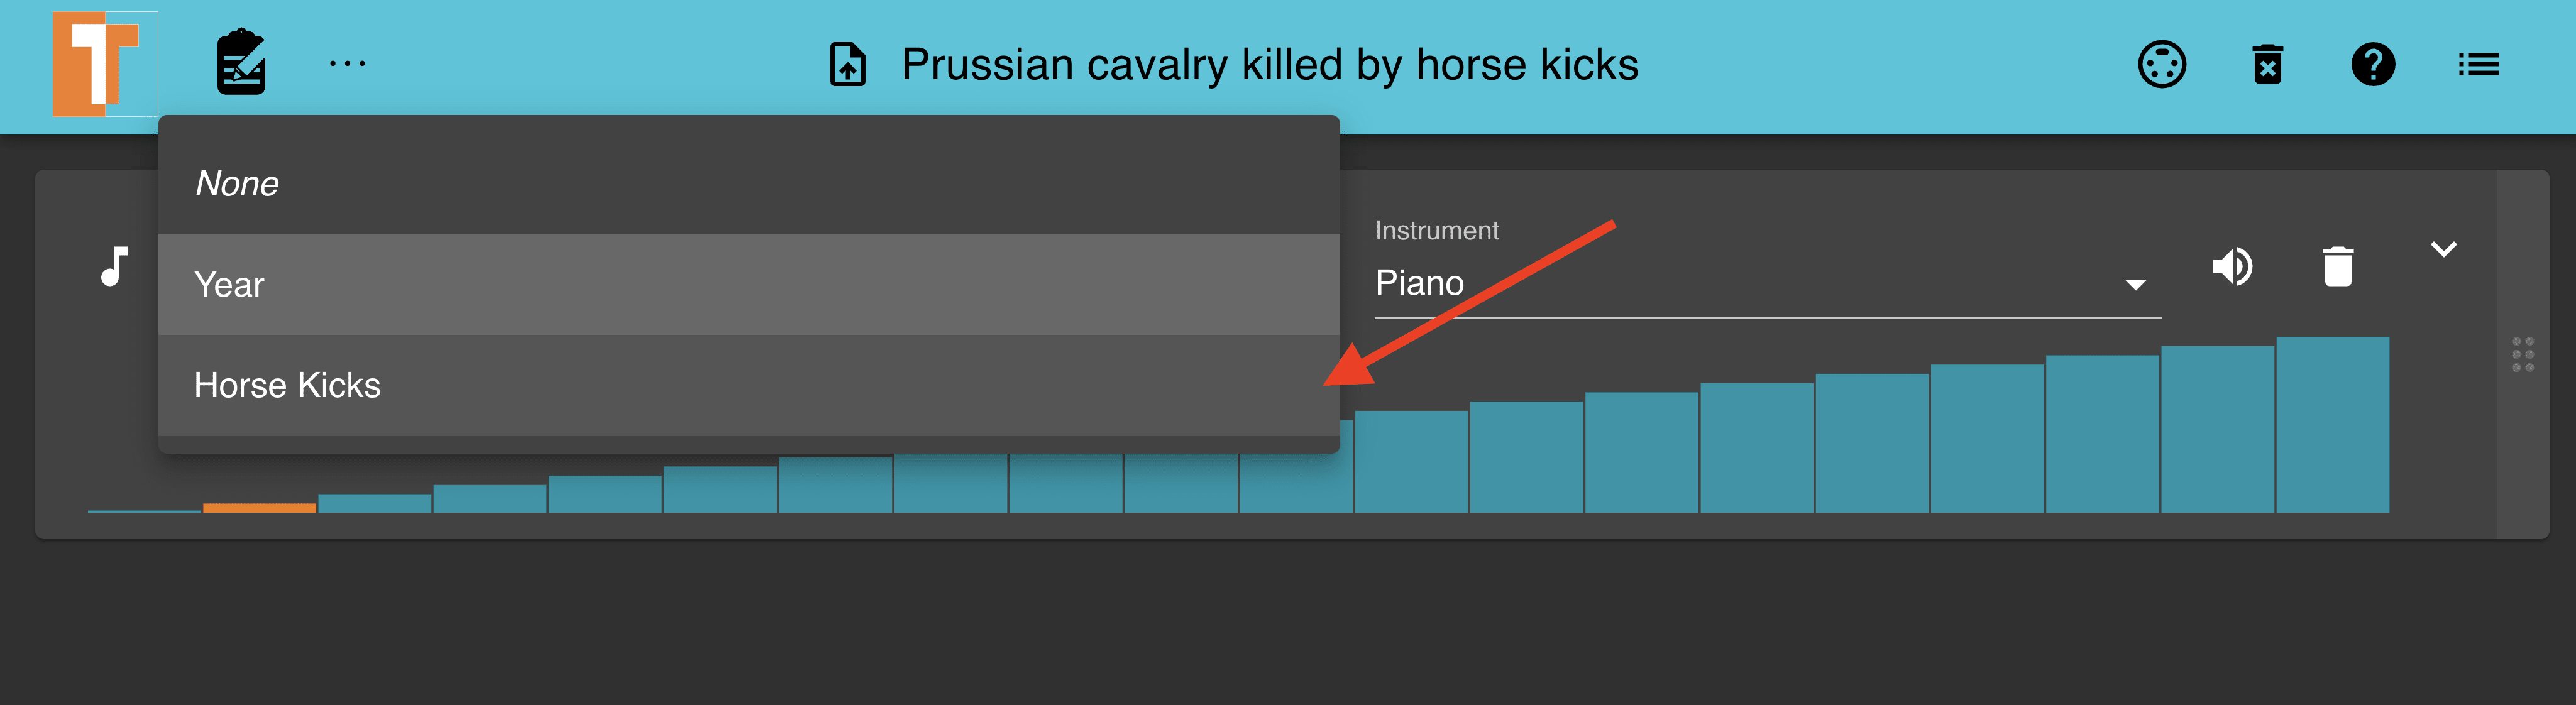
The Horse Kicks column within the dataset contains a variation of values in both ascending and descending order. Hence, the audio and bar chart visual generated by TrueTone contains variations.
The following image shows the TrueTone player visualizing the "Prussian cavalry killed by horse kicks" dataset by the Horse Kicks.
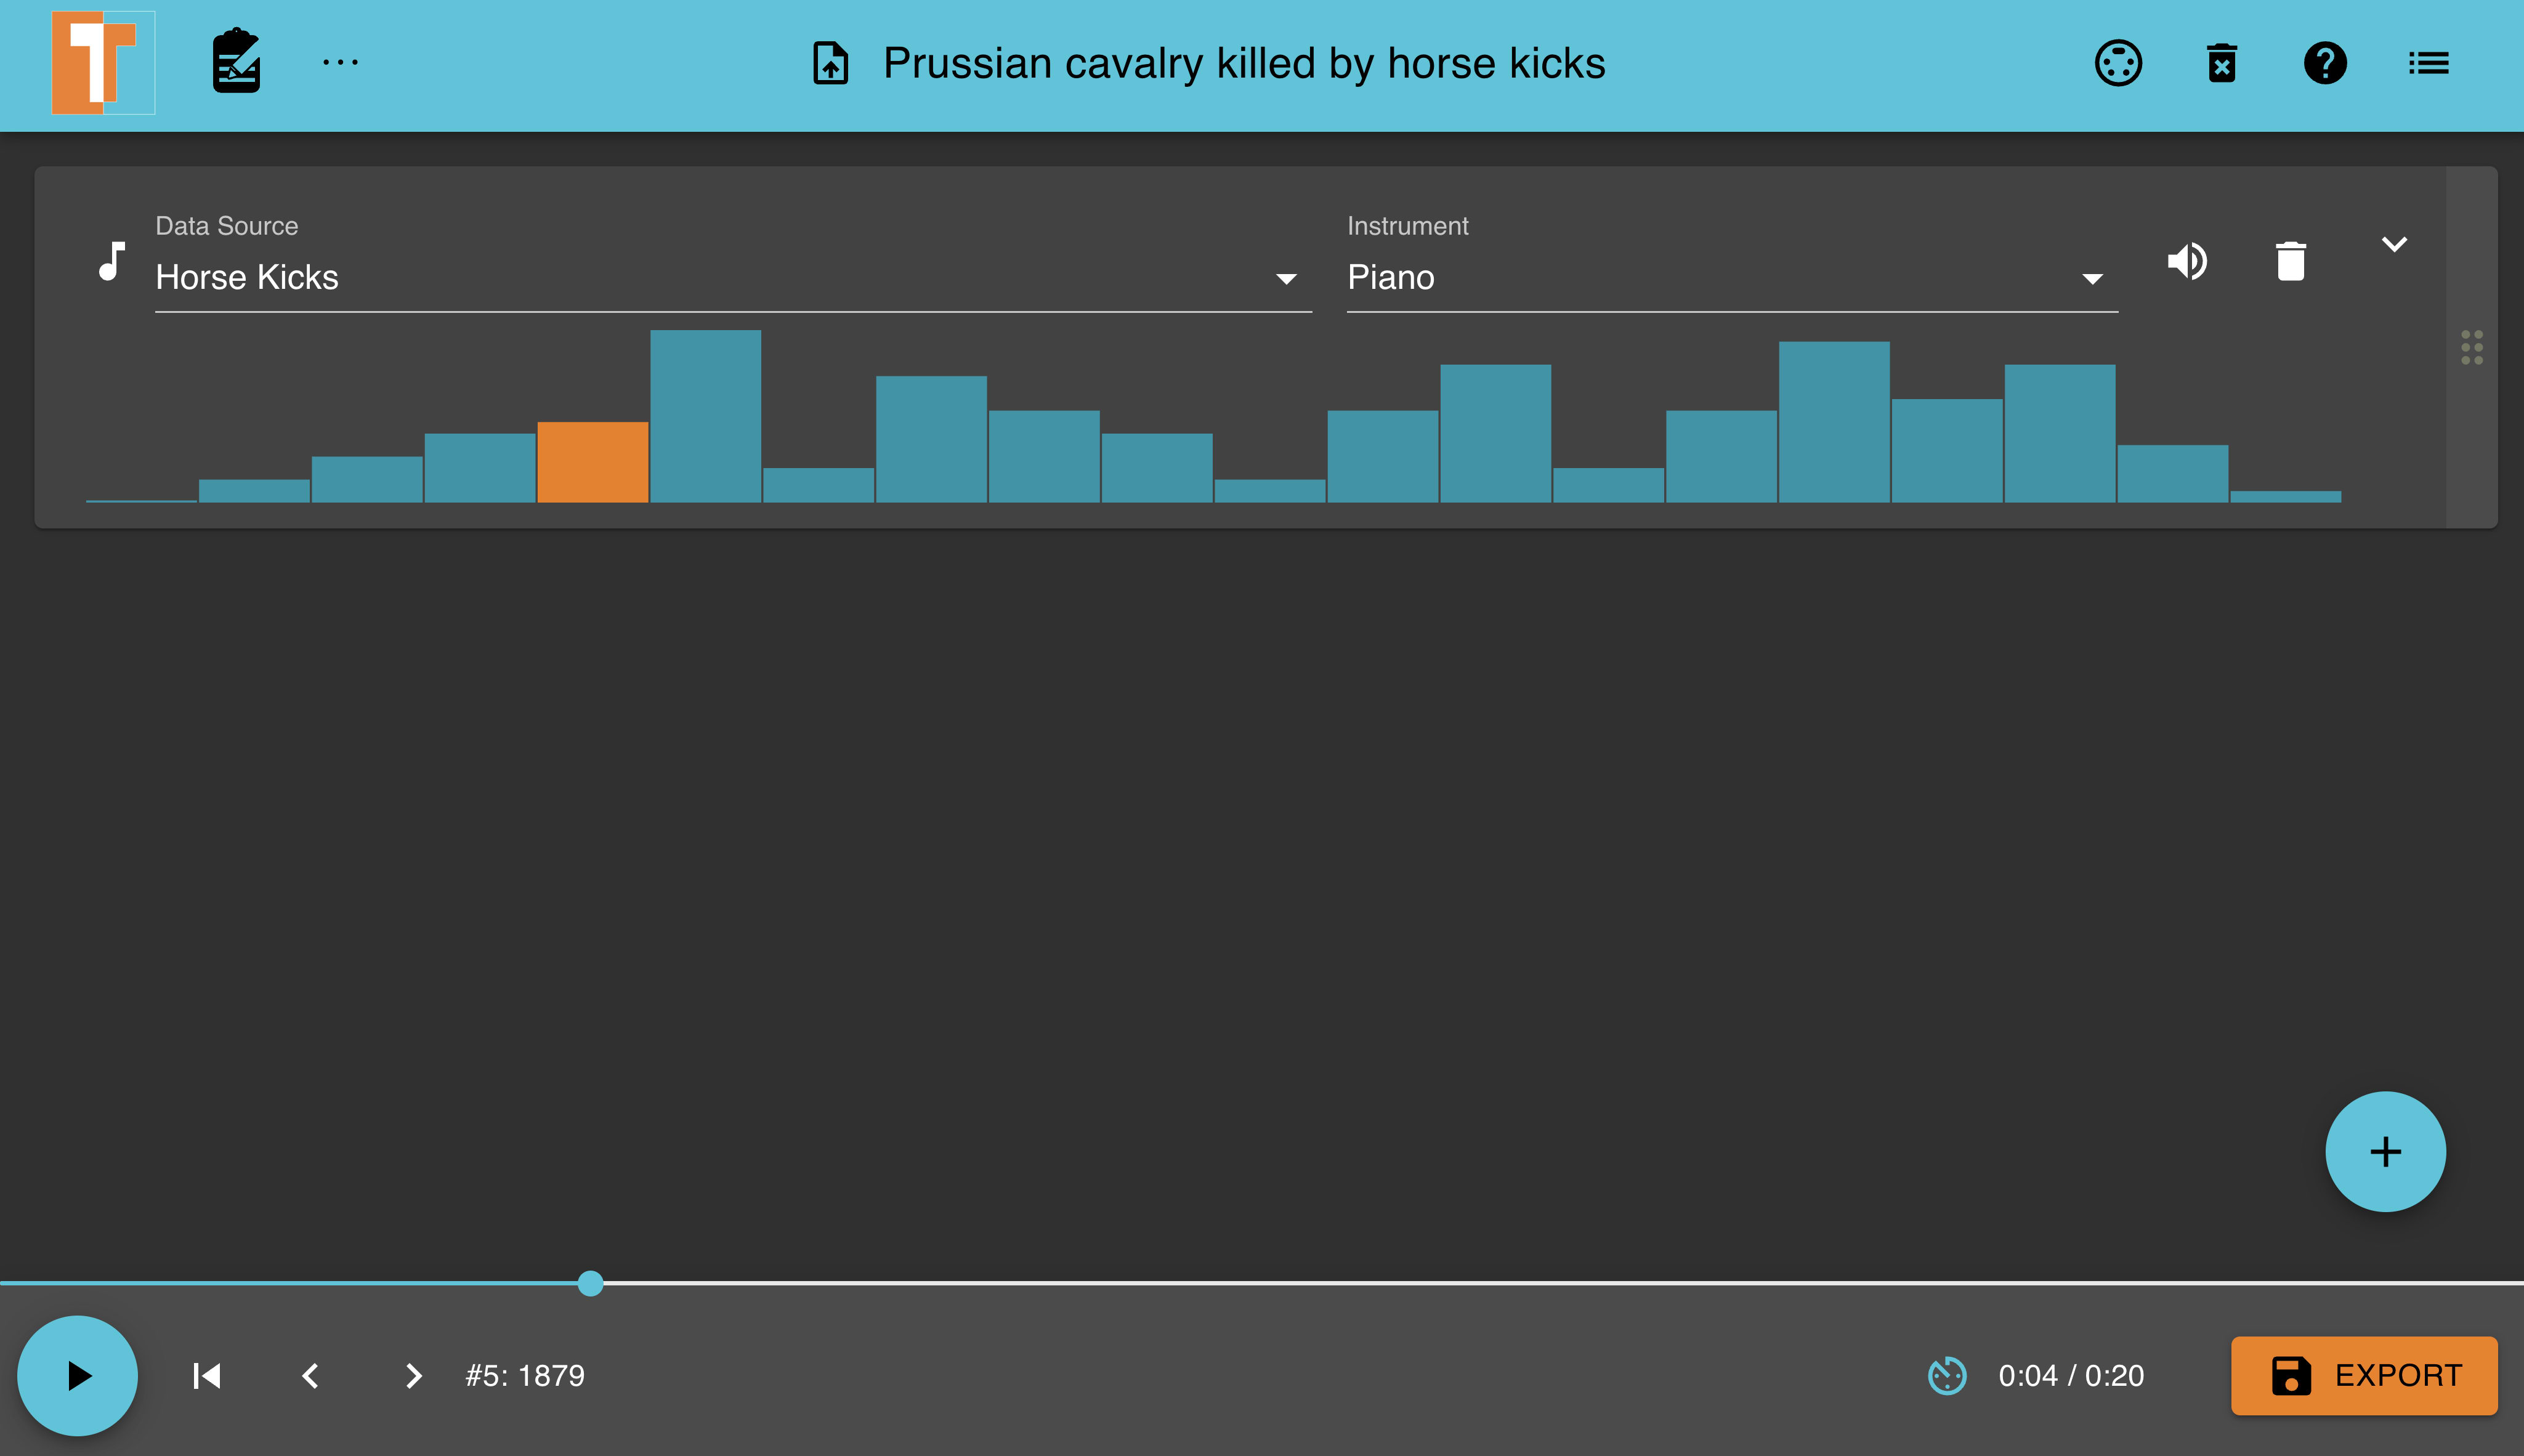
Below is the audio file generated using the Horse Kicks column with a Piano instrument.
Prussian-horse-kicks-piano.mp3
To explore more, we can change the audio instrument being used for the file from the Instrument dropdown as shown below;
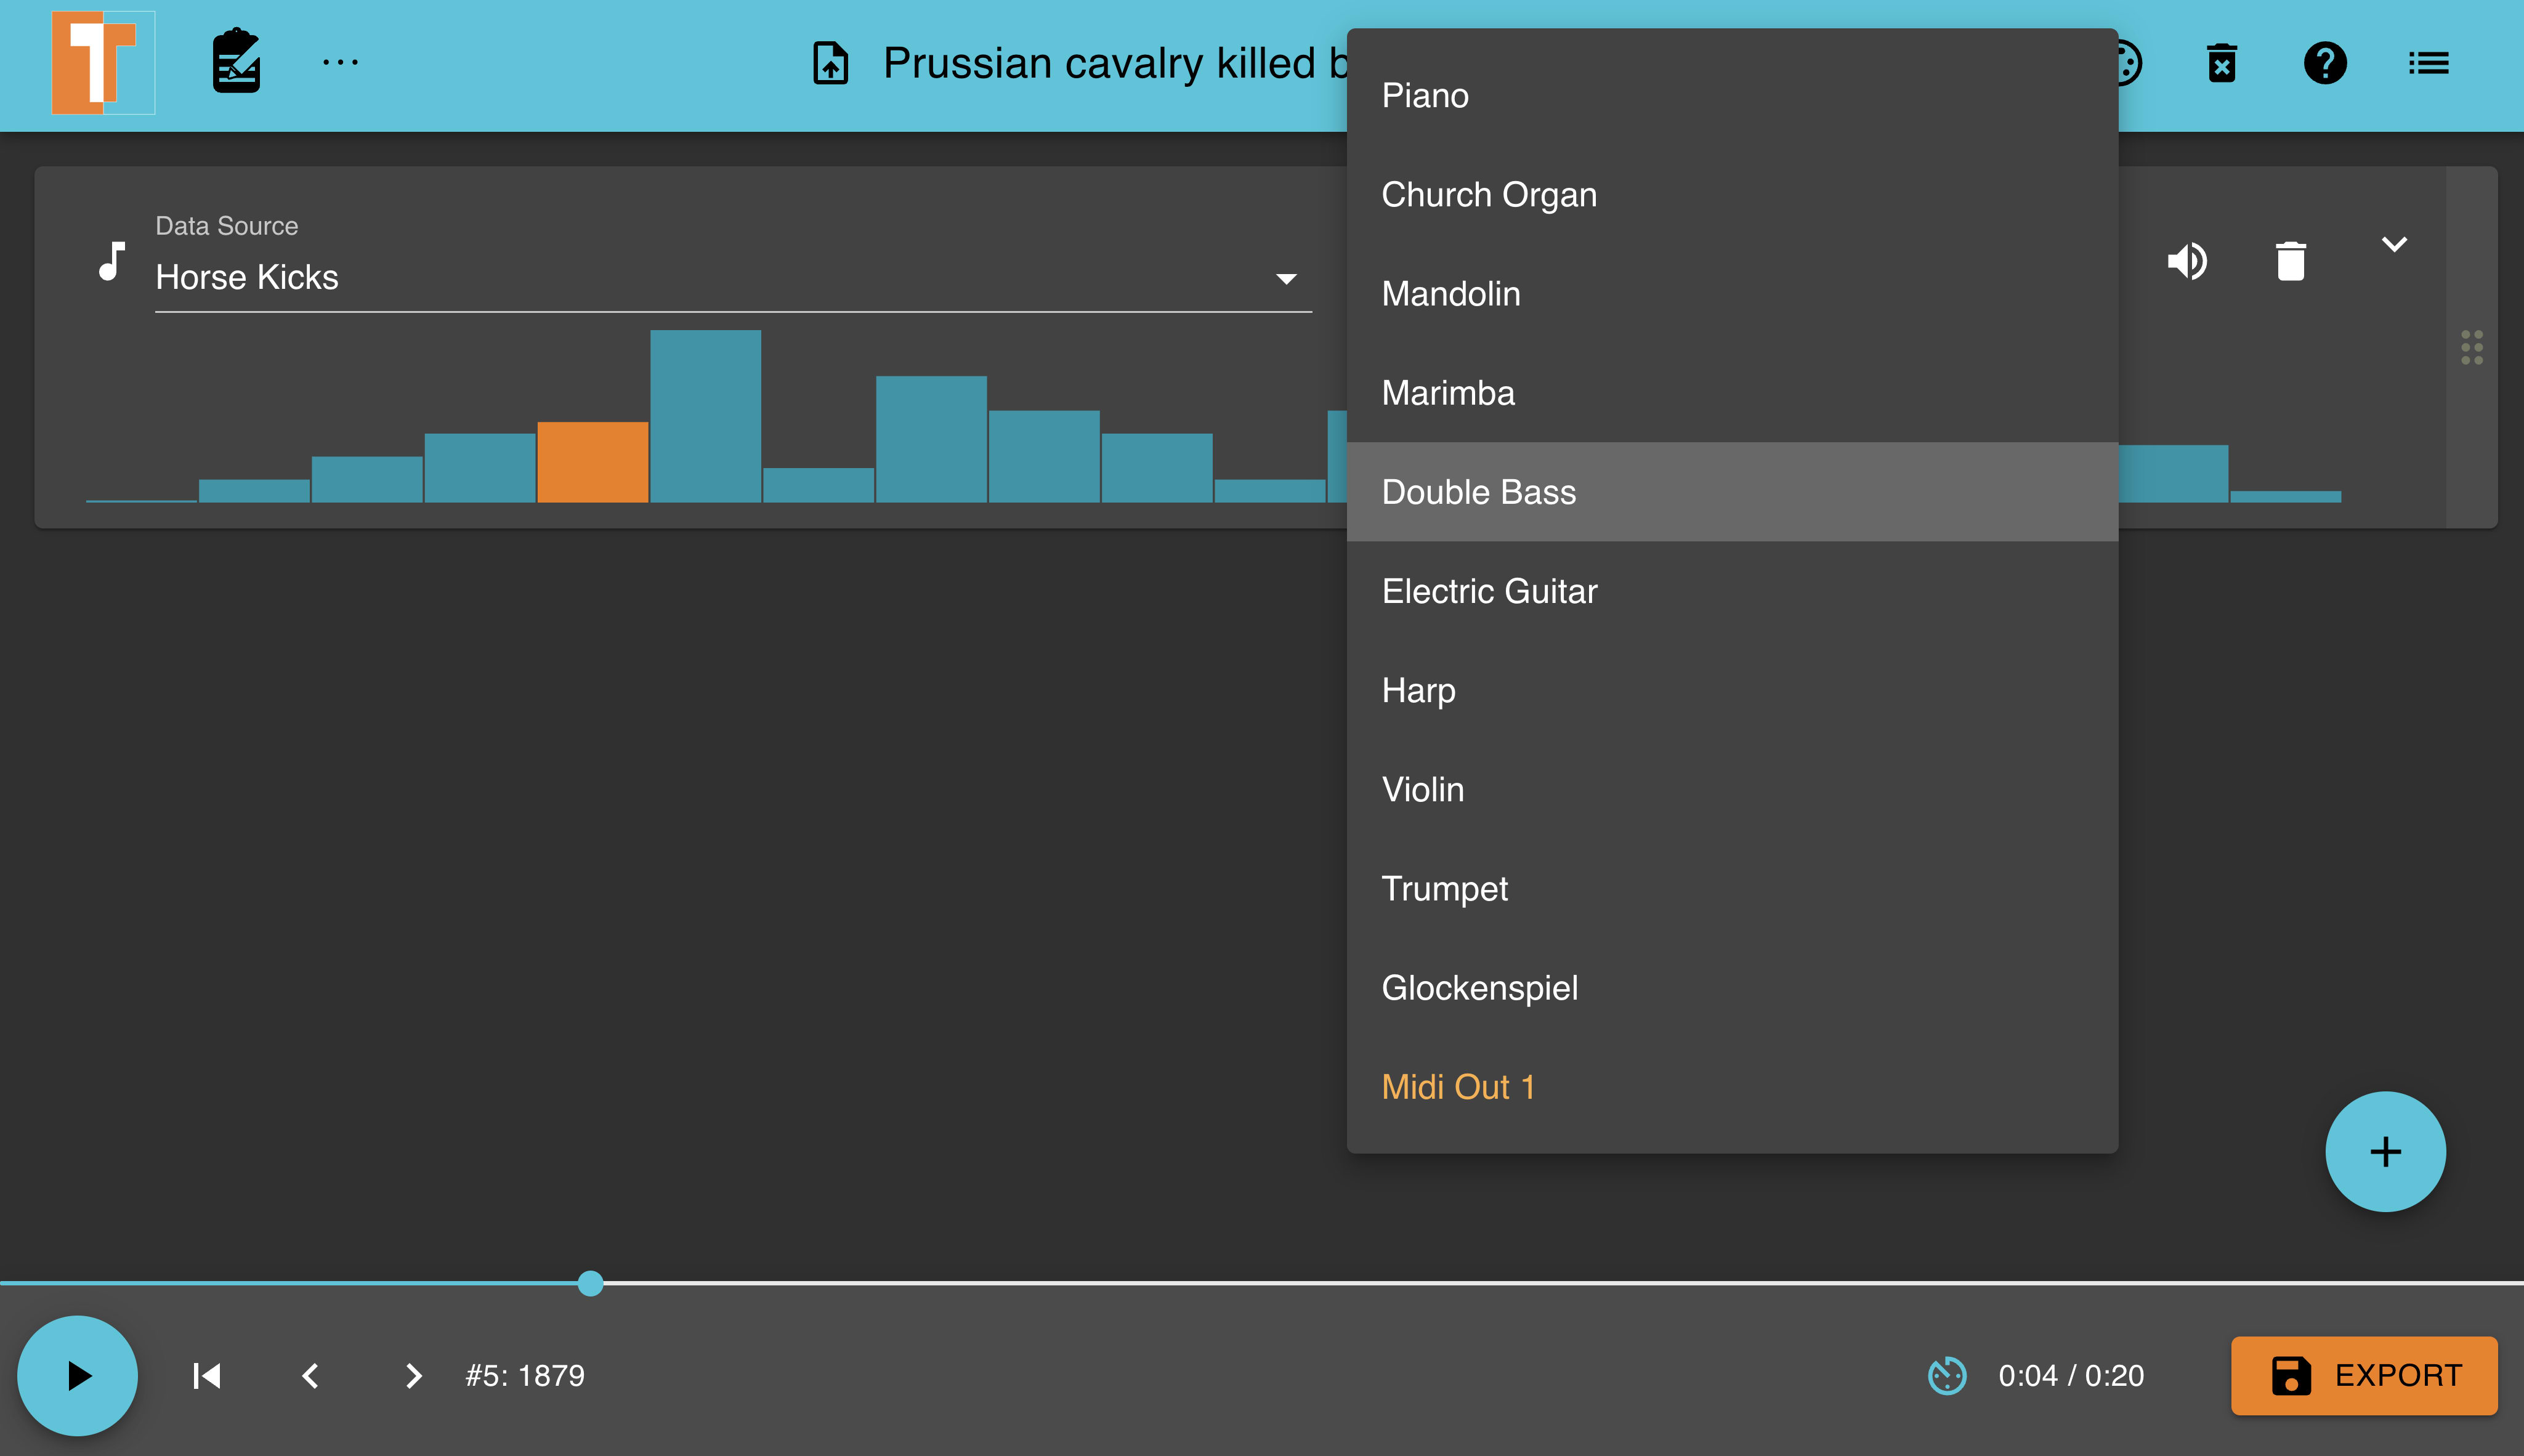
TrueTone generated the following audio file using the Double Bass instrument.
Prussian-horse-kicks-double-bass.mp3
Using a different dataset from the TrueTone application.
Aside from using the sample datasets with Truetone, we can also import custom datasets to generate audio files from them. Let's explore using a new dataset with TrueTone.
Step 1 — Importing the Kaggle dataset.
Click the file icon within the navigation bar to launch a modal for selecting a different data source.
From the Select Data Source modal, we need to click the lower section and select the Kaggle dataset from our device.
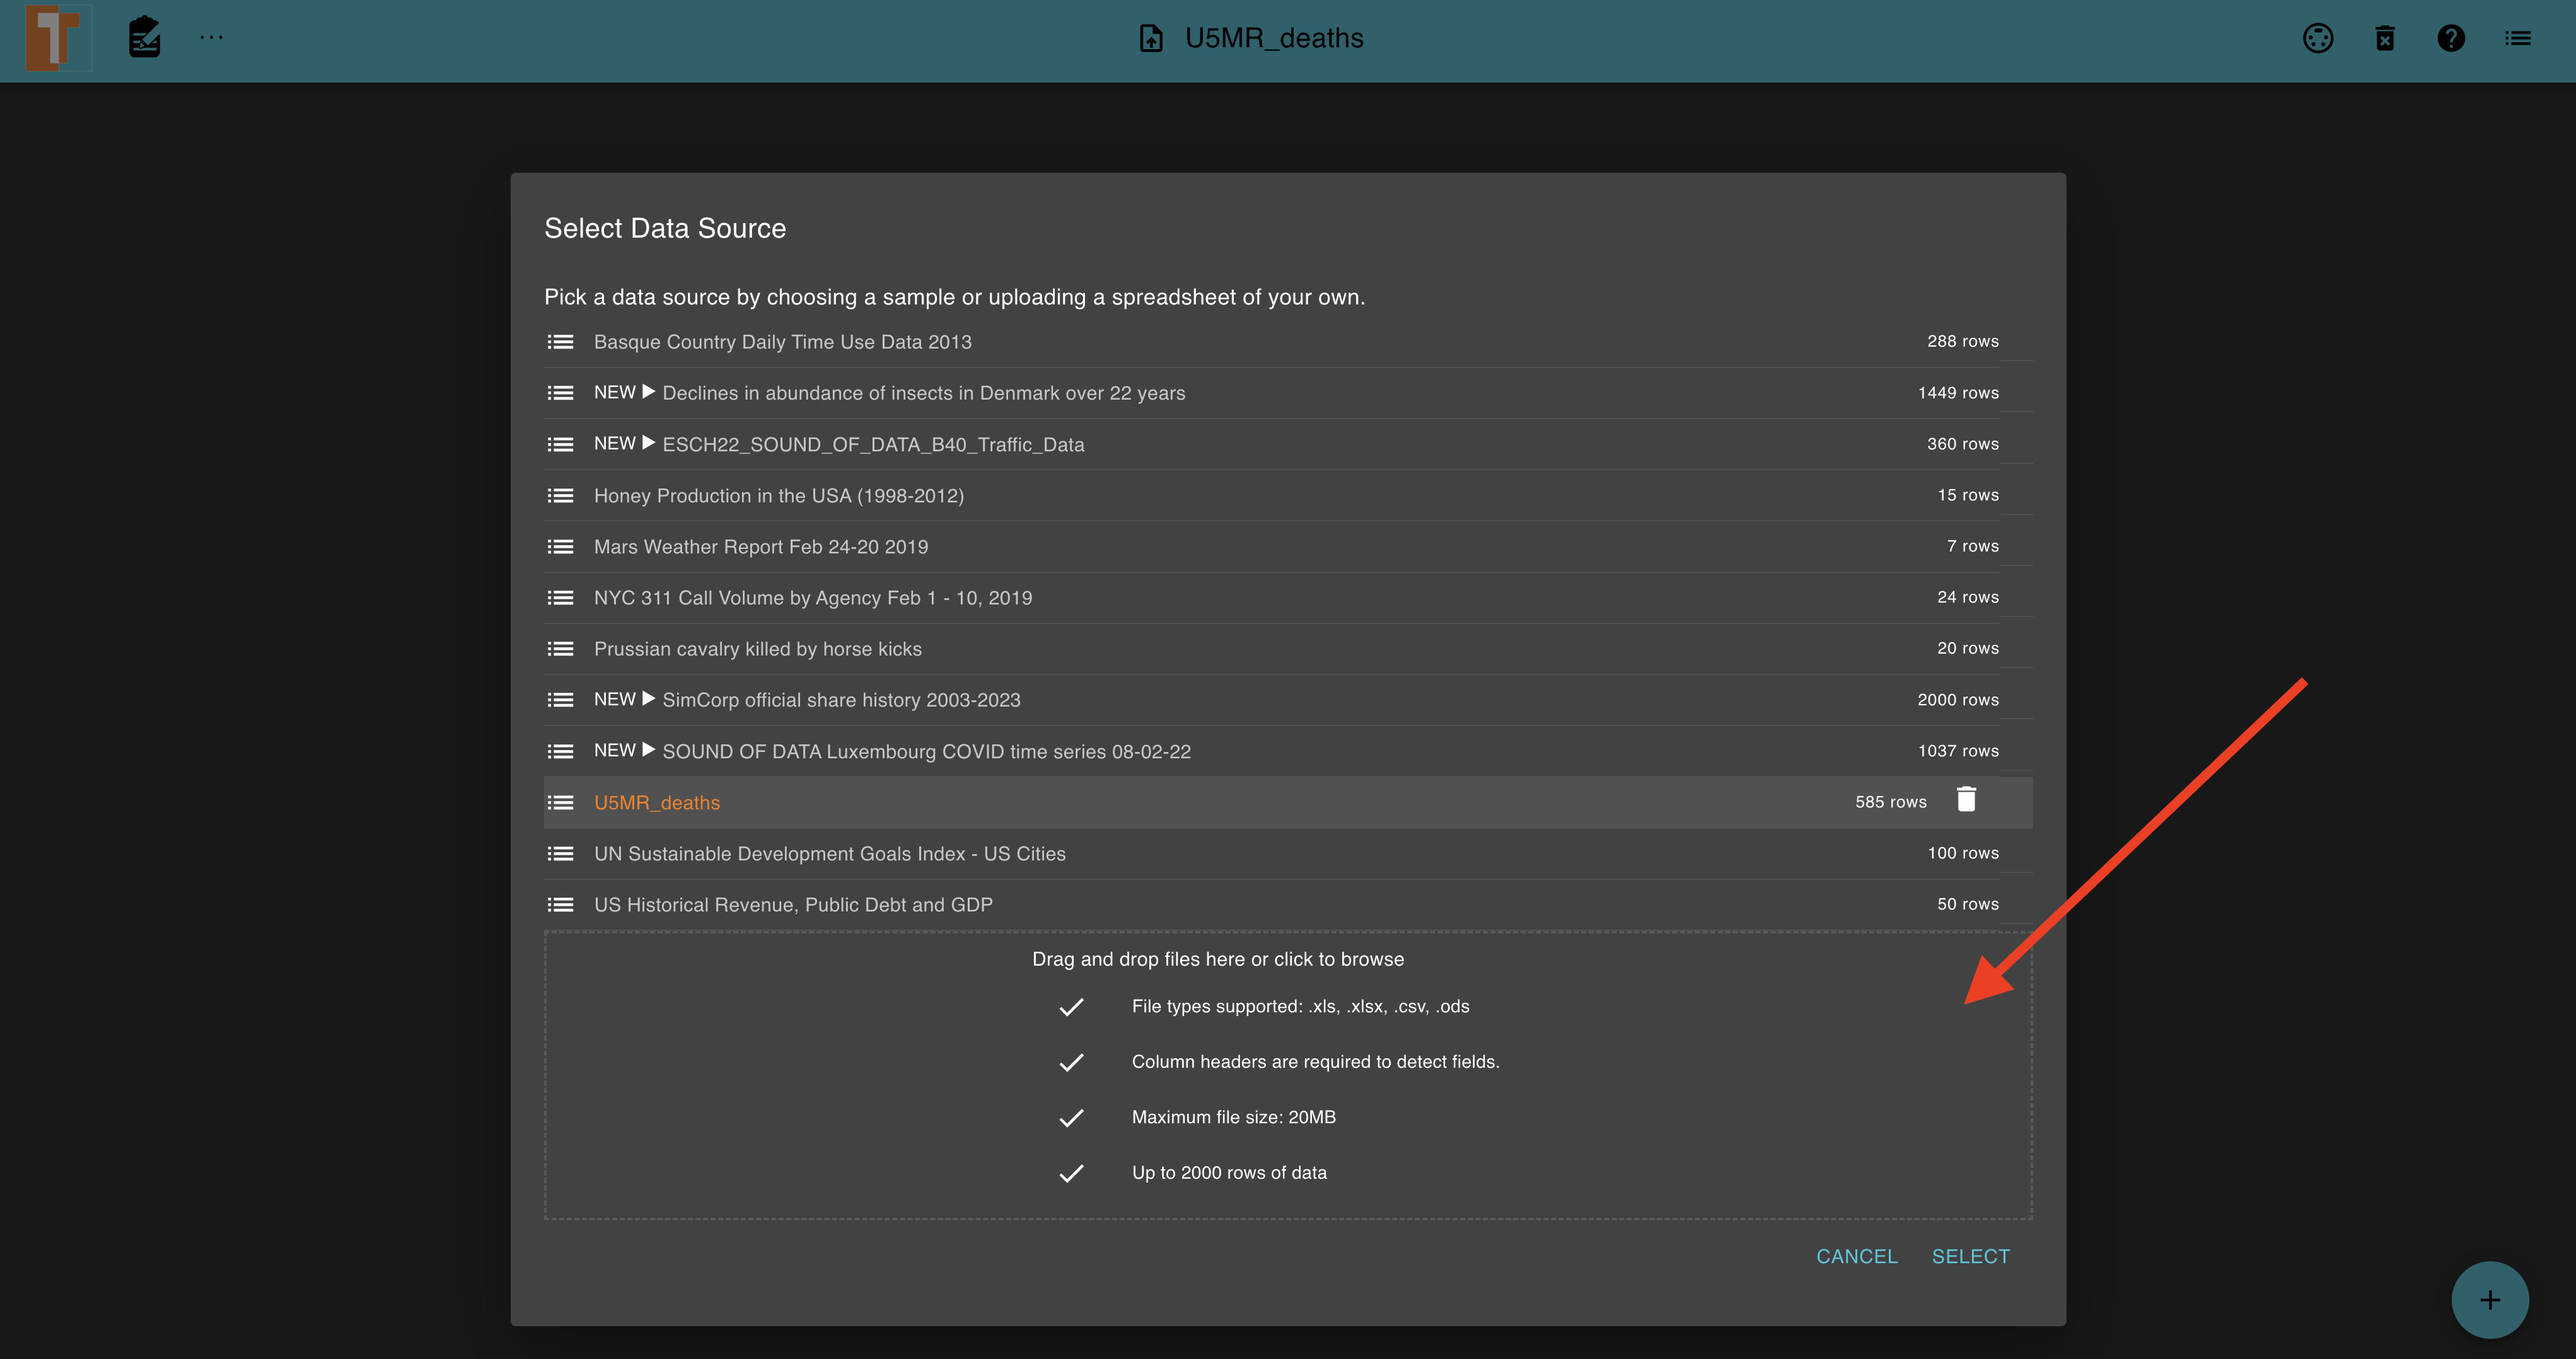
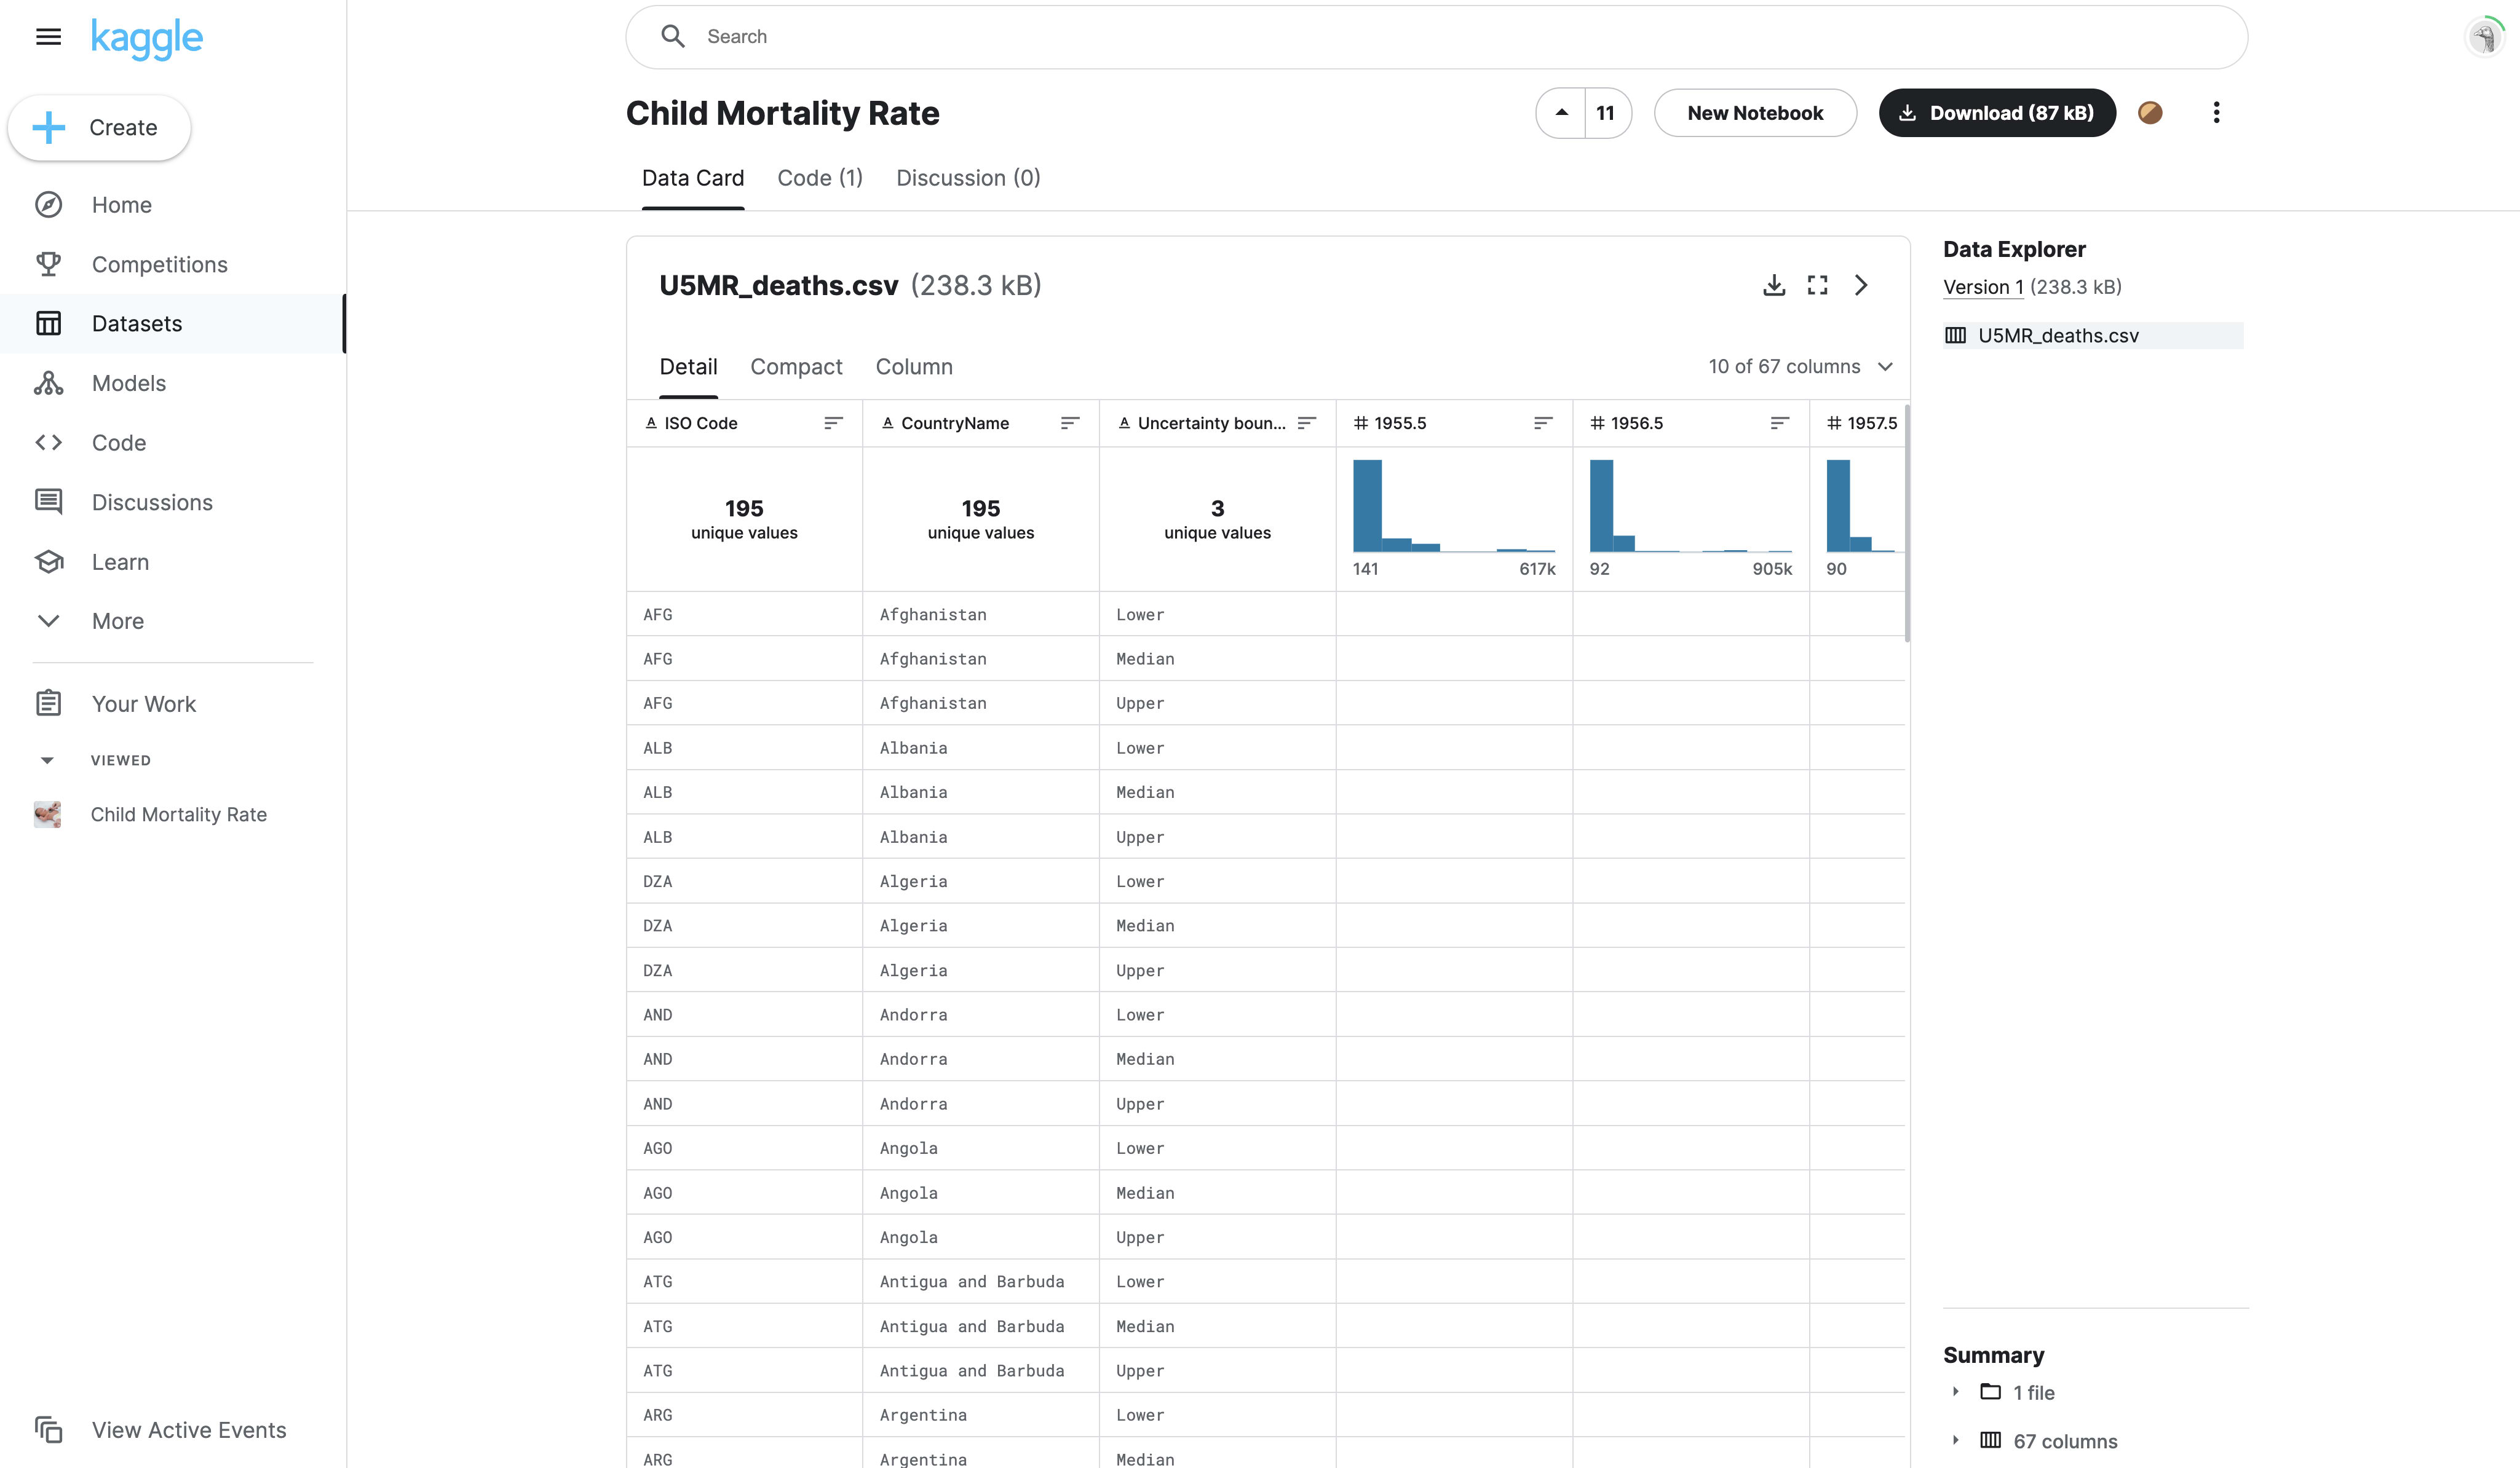
You will have to select the dataset file from your local device either in .csv or .xsls format for TrueTone to import and generate audio from it.
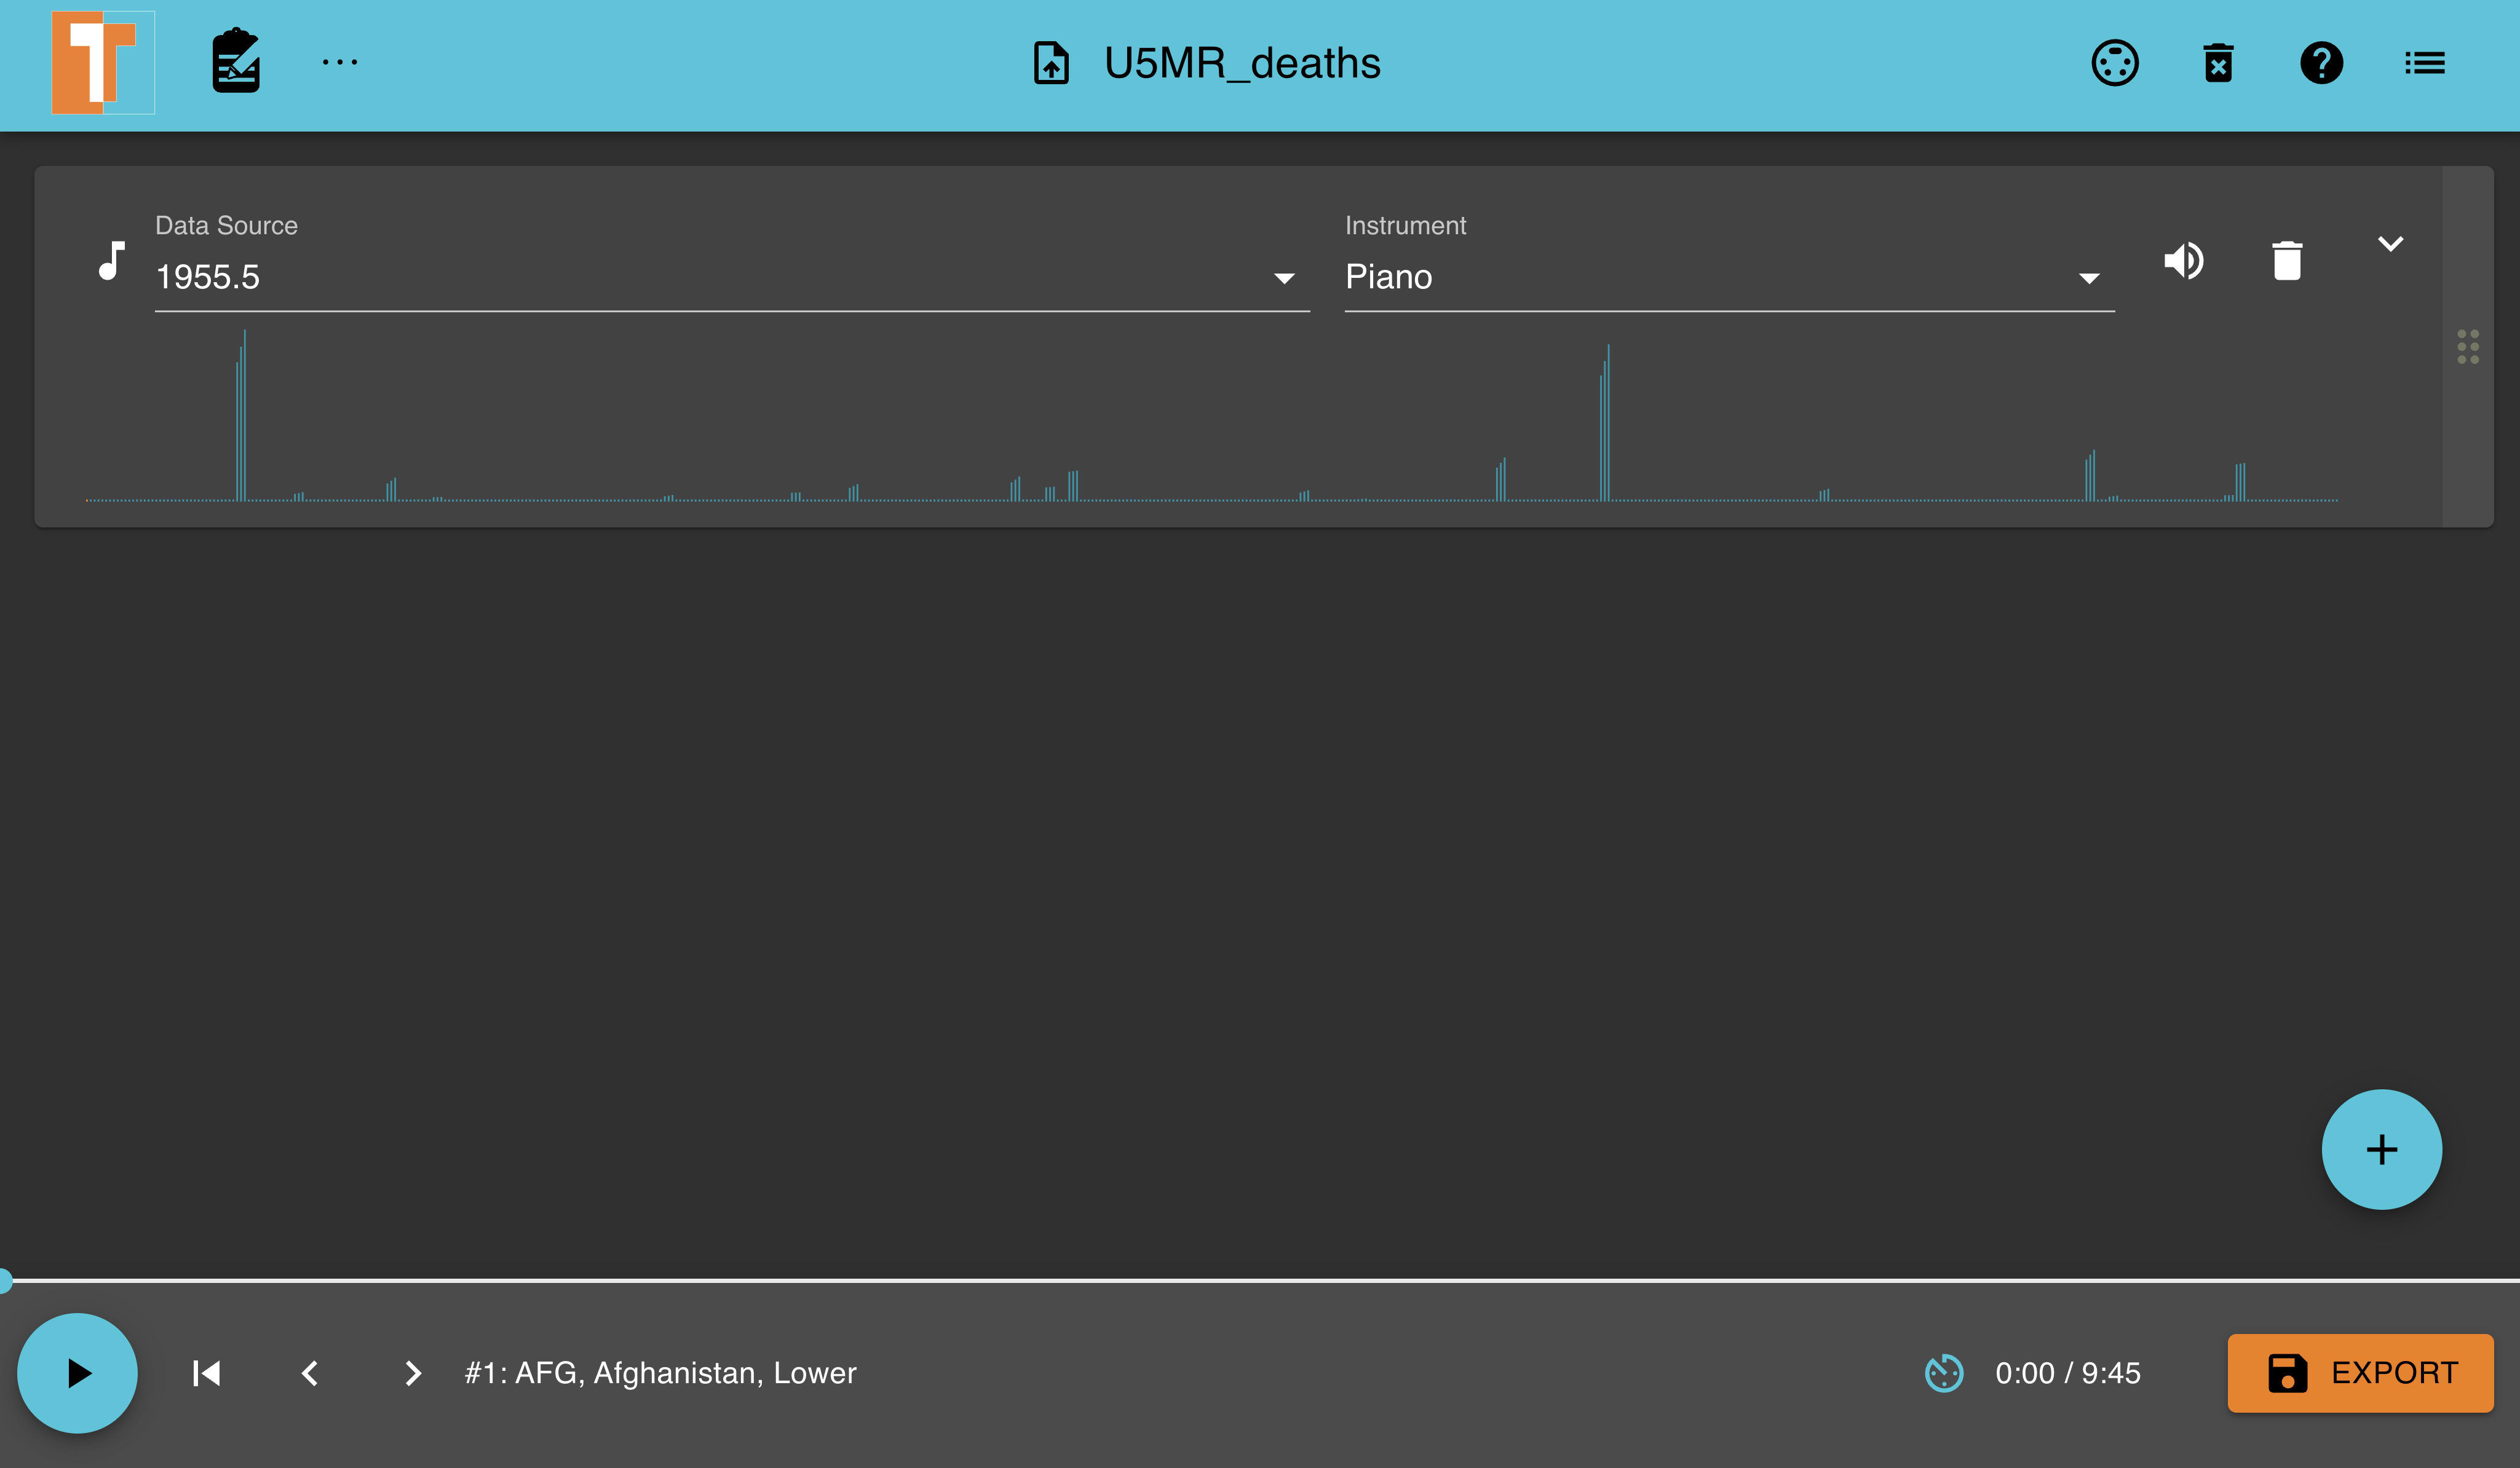
Below is the audio file generated using the 1995 column within the U5MR_deaths dataset with a Piano instrument.
U5MR_deaths-piano.mp3
Considering the dataset has over 585 rows, it could become too slow or boring to listen to. We can speed it up!
Click the Caret icon to reveal advanced options for the audio. The advanced options contain a Track Tempo dropdown allowing you to alter the audio by speeding it up.
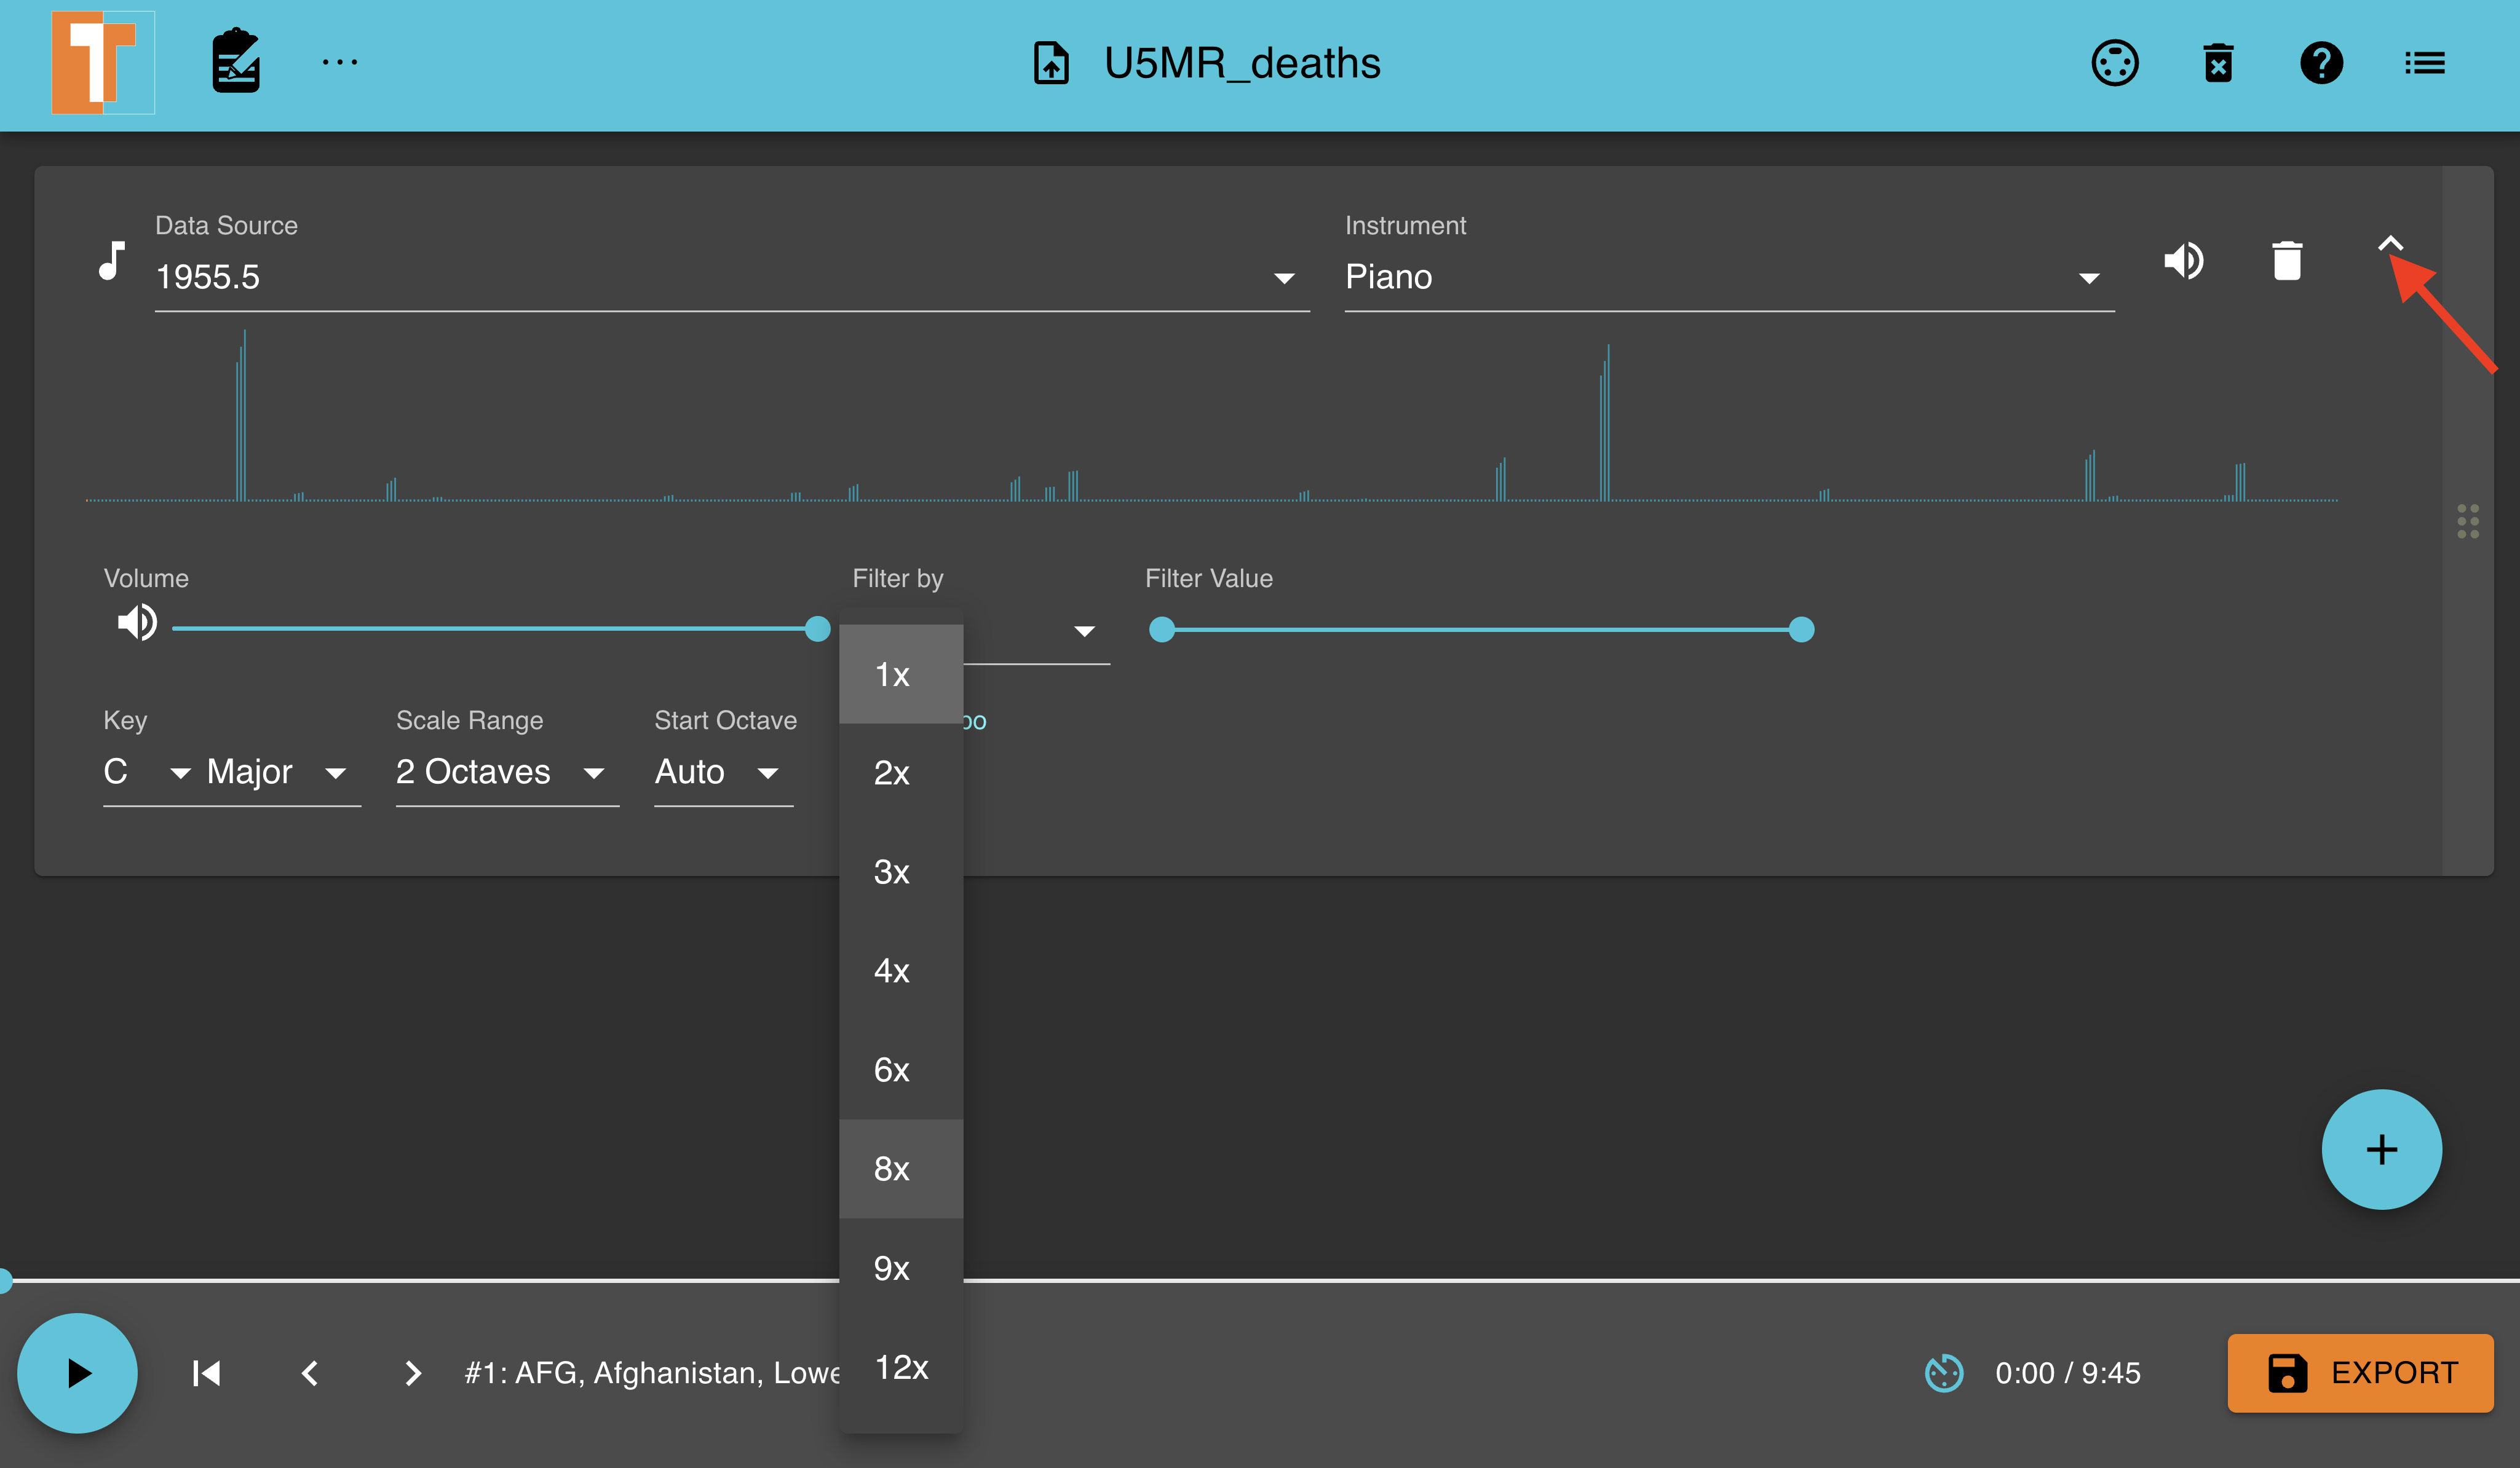
Below is the audio file generated using the 1995 column within the U5MR_deaths dataset using a 9X Track Tempo speed.
U5MR_deaths-9x-tempo.mp3
Conclusion
Within this lab, I learned about Sonification and its importance in the data industry today. I also learned how to use the TrueTone software to generate audio on datasets and how to customize the audio by tweaking the audio settings.
Further Readings
The Sonification Handbook by Thomas Hermann, Andy Hunt, John G. Neuhoff.
Theory of sonification by Bruce N. Walker and Michael A. Nees.